Weak numbers from Chine offset strong Q3-reports from the US


Yet another weak statistical figure from China weighed on the stock market on Friday, despite US company reports continuing to come in better than expected. China's GDP growth landed at 6 percent, which is the weakest growth for 30 years. Given that it is in China's interest to keep this GDP figure as high as it can be, the decline is certainly sharper than reported.
Yet another weak statistical figure from China weighed on the stock market on Friday, despite US company reports continuing to come in better than expected. China's GDP growth landed at 6 percent, which is the weakest growth for 30 years. Given that it is in China's interest to keep this GDP figure as high as it can be, the decline is certainly sharper than reported.
On the other side of the spectra we find the reports from US companies’ generally beating expectations. However, in principle, everyone has been negative in the outlook ahead of this reporting season, so this time it seems that expectations have been lowered enough to make the reports turn out better than anticipated.
The number of companies in the S&P 500 index that have reported their earnings has increased from 23 to 74 in one week. This means that the figure 82 percent of earnings better than expected has a higher degree of statistical significance. But even in terms of revenue, the outcome has improved, now 62 percent is better than expected even in terms of sales. The best performing sector is cyclical consumer goods, where all ten reports so far have exceeded analysts' forecasts at a profit Level.

Skew shows the pricing of downside puts in relation to upside calls. A high skew-value imply that investors are willing to pay up to protect its portfolio with downside puts. Thus, the Skew-index (on S&P 500 in the US) as shown in the graph below suggest that the risk has shifted to the downside.

S&P 500 is however still trading in a short upwards sloping trend above its MA20 as well as EMA9. This still leaves the window open for testing previous tops from September and July serving as resistance levels. MACD is positive and rising meaning that the momentum is positive.

However, in the 1-hour graph below the index is still awaiting new energy for further advancement upwards. The longer the time goes, the greater the probability of a downward test, as evidenced by the MACD which is falling. First level of support can be found around 2 950 followed by 2 925.

Bull & Bear-certifikat
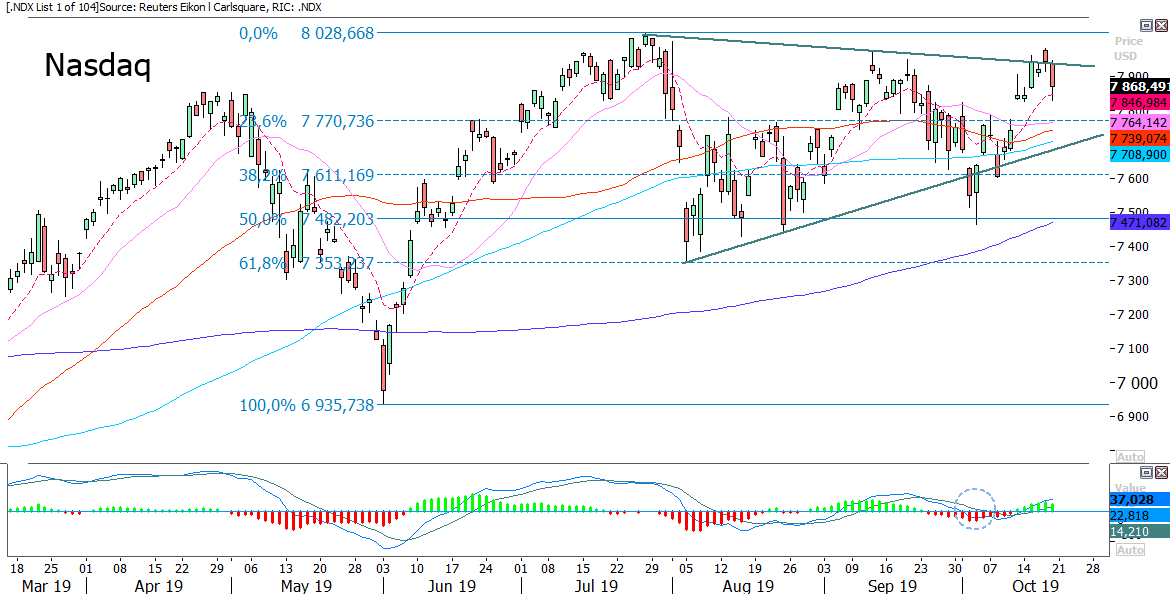
Tech heavy Nasdaq made a try to break up above to the falling line it what may appear as a neutral triangle. However, the index closed back inside the triangle on Friday. As for S&P 500, Nasdaq is trading above its EMA9. MACD is positive and rising giving room for a test previous top from July serving as resistance. First level of support is made up by EMA9 followed by 7 770:
Bull & Bear-certifikat
The USD-index has fallen to its MA200. The likelihood of an interest rate cut at the next Fed meeting has increased to 91 percent, according to CME FedWatch Tool, which measures pricing in the market. But it is not only the weak macro in the US and interest rate expectations that come into play. Brexit is another important factor.
EUR/USD in the graph below closed Friday´s trading above MA100 and Fib 50% under strong momentum. The next level on the upside can be found at 1,121. Support on the downside can be found around 1,108:

Strong development in Europe as Brexit negotiations goes on
The whole EU, including the UK, would benefit from a Brexit agreement, almost no matter what it looks like. During the last week of trading, the German DAX was sniffing at levels above previous top from the beginning of July. Intraday movements were largely implying that the level of uncertainty is high. The first support can be found slightly below the 12 500-level.

Bull & Bear-certifikat
OMXS30 closed Friday´s trading above previous high. The psychologically important 1 700-level remains to be broken. Note that RSI is at overbought levels. However, this is standalone not a sell signal. The now broken top from September serves as first level of support, followed by EMA9:

Bull & Bear-certifikat
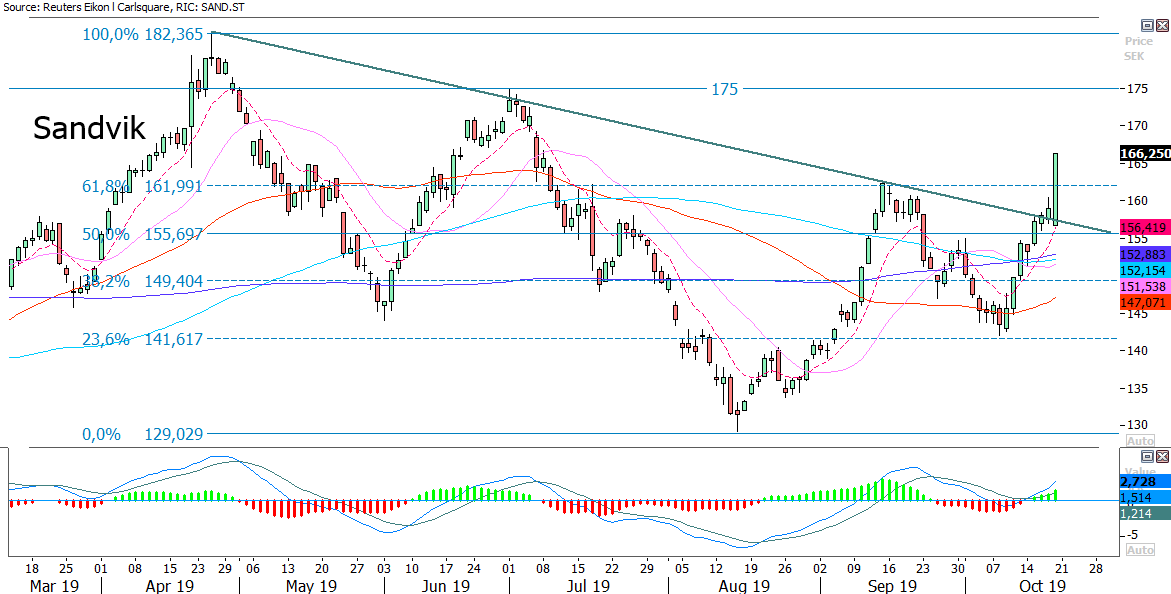
Sandvik is breaking up
The Sandvik share rose by 4,6% in value on its Q3-report. The share closed near its highs and well above Fib 61,8%. The road to 175 kronor-level serving as first resistance level seems open. Support on the downside can be found at 162 kronor:
Bull & Bear-certifikat
Is there further downside to Netflix?
Netflix reported growth in number of subscribers and better earnings than expected. However, the share has fallen in value and competition is expected to increase from Apple as well as from Disney. MA20 and the short rising trendline is now serving as support. In case of a break on the downside, previous low from September serves as resistance. Fib 23,6 at 283,8 is the first level of resistance followed the Fib 38,2 right above the psychological important 300-level:

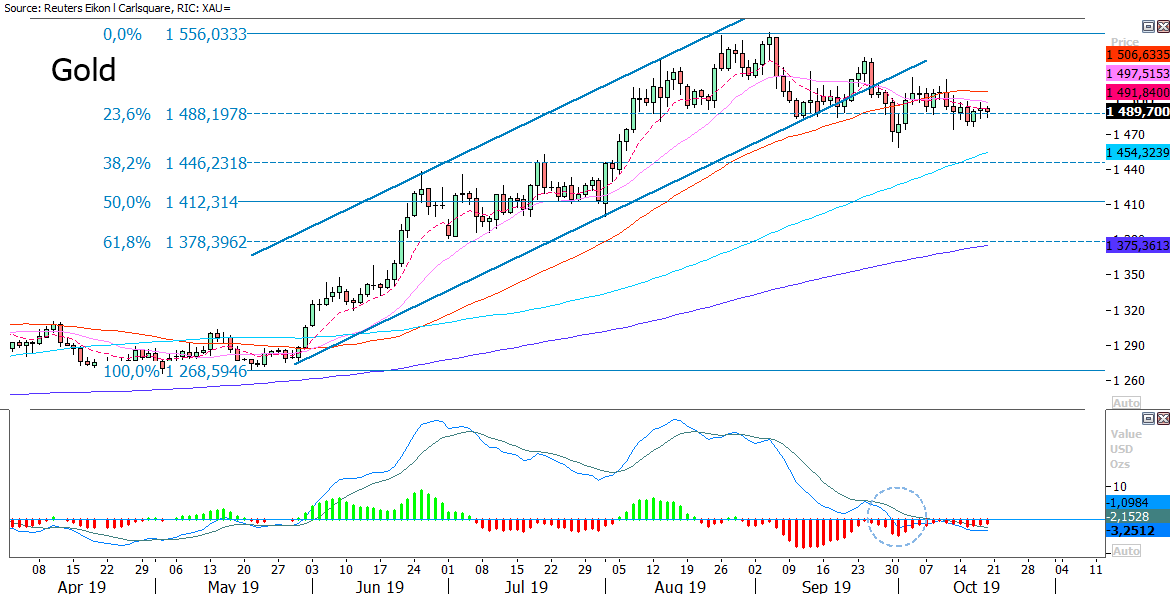
Weaker USD does not make it for gold
Gold is given support by the weaker USD but do not manage to break out from its consolidation phase around Fib 23,6%. The metal is trading below its MA50 as well as its MA20. MACD is in negative territory and momentum is falling. Rising MA100 make up a first level of support in case of a break to the downside. Should the risk/uncertainty increase in the market there may be an upside for gold. MA20 and MA50 serve as resistance. The next level on the upside can be found around 1 530:
Mini Future
Risker
This information is in the sole responsibility of the guest author and does not necessarily represent the opinion of Bank Vontobel Europe AG or any other company of the Vontobel Group. The further development of the index or a company as well as its share price depends on a large number of company-, group- and sector-specific as well as economic factors. When forming his investment decision, each investor must take into account the risk of price losses. Please note that investing in these products will not generate ongoing income.
The products are not capital protected, in the worst case a total loss of the invested capital is possible. In the event of insolvency of the issuer and the guarantor, the investor bears the risk of a total loss of his investment. In any case, investors should note that past performance and / or analysts' opinions are no adequate indicator of future performance. The performance of the underlyings depends on a variety of economic, entrepreneurial and political factors that should be taken into account in the formation of a market expectation.