Momentum calls for further upside. But warning signals can be found


With a final push during the last hour of trading, the US stock exchanges closed on the plus. There is continued sector rotation towards cyclical shares relative to defensive shares that is characterizing the trading. There are two months left of the year and if nothing unforeseen occurs, the positive trend can continue until the end of the year.
With a final push during the last hour of trading, the US stock exchanges closed on the plus. There is continued sector rotation towards cyclical shares relative to defensive shares that is characterizing the trading. There are two months left of the year and if nothing unforeseen occurs, the positive trend can continue until the end of the year. Trump continues to argue that a Phase 1 of a trade agreement is close, but China does not appear to be as close to concluding this agreement as the United States.
In the 1-hour graph below one can see how the index hit the channel ceiling during the last hour's of trading. Note that a new parallell trend channel may be about to be created shown in the form of the dotted orange lines. As long as the MA lines is upwards sloping in orderly formation, the rising trend is intact.

The graph below shows how the S&P 500 continues to rise evenly with the upper Bollinger band and with a good margin to its EMA9 (dark pink plotted line). At the bottom is seen how the falling trend line in MACD is broken. As long as the EMA9 is unbroken, the trend is rising.

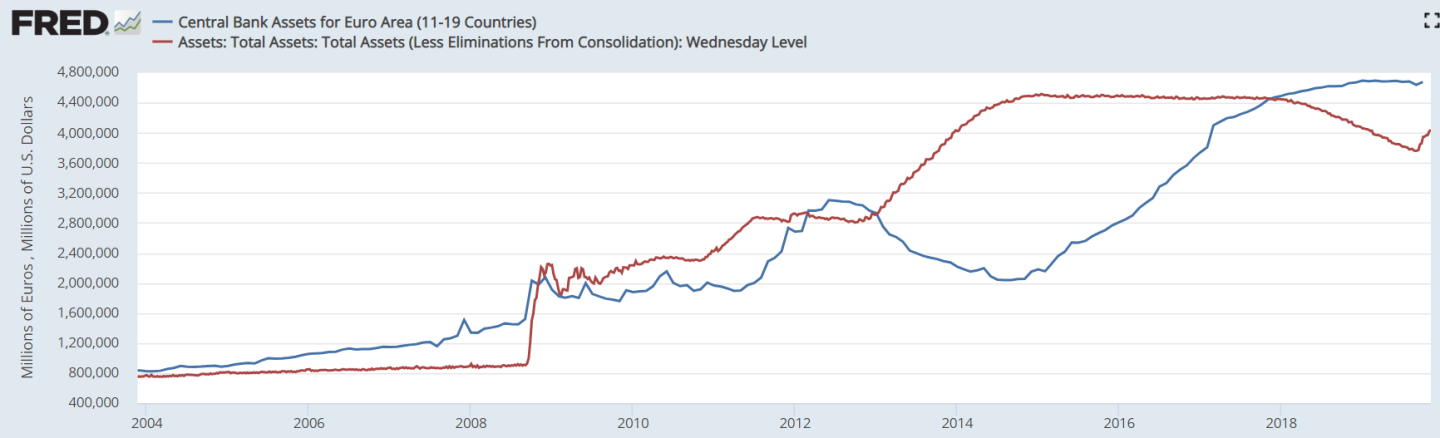
The central banks' balance sheets increase both in the US (red) and in the EU area (blue). This is the money that is created out of nothing when central banks buy assets in the bond market and place them on their own balance sheets. This money flows further into the economic system and may continue to boost the stock market.
Though the trends are strong and supported by good momentum there are however also some warning signals. As could be seen in the daily graph (second picure) the index has reached its first level of the extended Fibonacci sequence. In the weekly graph a bearish rising wedge pattern can be identified that typically breaks on the downside:

“Fear index”, VIX, showing the expected volatility in the upcoming 30 days is also raising a warning flag. As can be seen in the graph below the index fell sharply in July. At the same time VIX was down at low 12,05. Once again VIX is down at this level and history do often tend to repeat itself.

Bull & Bear-certifikat
Tech-heavy Nasdaq closed the week on a new all-time-high. Once again, by extending the Fibonacci sequence the next level of resistance can be found around 8 287. As well as for S&P 500 the momentum is strong and MACD has broken its declining trend. EMA9 followed by rising MA20 and the previous top act as support levels on the downside:

Bull & Bear-certifikat
Somewhat puzzling is that the USD is rising despite that Fed increases its balance sheet. Apparently, the correlation between the central banks' outflows and exchange rates has decreased. An answer may be that almost all central banks stimulate so the effect on currencies take each other out.
The correlation between economic development and currencies should be stronger, and there the US economy is doing better than in for example Europe. As can be seen in the graph below, the USD has also strengthened against the euro and closed last week´s trading below MA50. The next level on the downside can be found around 1.1. In case of a bounce, falling EMA9 and 1.108 make up the first levels of resistance.

Bull & Bear-certifikat
Below is the weekly graph for the German DAX index. As can be seen the index totally ignored the bearish rising wedge and do now seem to be set for a continued move upwards towards previous tops:

Also, as can be seen below in the daily graph, DAX gapped through both the first and second level of the extended Fibonacci sequences. However, the third level (150) of the extended Fibonacci sequence is seen as extra important is not there yet. In case of a bounce to the downside the two broken Fibonacci levels serve as support levels along with a rising EMA9.

The Swedish OMXS30 index managed to break through its first level of the extending Fibonacci sequence. Momentum is positive and EMA9 as well as MA20 and MA50 is rising which reflects the strength of the momentum in this case. The next level on the upside can be found around 1 812 where extending Fibonacci 150% meet up.

However, the second level of the extending Fibonacci sequence is still standing strong and as can be seen momentum is fading. EMA9 makes up support to the downside along with Fib 123.6 around 1 753. After that, a rising MA20 serves as the next level of support.
Bull & Bear-certifikat
Potential further downside in H&M
The H&M stock has fallen which partly explain why OMXS30 have not managed to follow its European peer DAX. As can be seen in the graph below, the H&M share closed last week below MA50 as well as the floor on the rising trend. Worth noticing is also that MACD is close to generate a sell-signal. The next level on the downside can be found around SEK 183.

In case of a bounce up, the floor on the rising trend as well as MA50 serves as first levels of resistance. Falling EMA9 and MA20 serves as second and third line of resistance on the upside:
Bull & Bear-certifikat
Tesla deserves to test its previous tops
Tesla surprised the market by showing profitability for the third quarter 2019. The share has since then rallied but is now facing resistance as shown in the weekly graph below. MACD has generated a buy signal and broken its falling trend. Given the strong result one may think that the Tesla share deserves to test previous tops from Q2/Q3 2017. However, before that another resistance level around 360 needs to be broken.

In case of a setback in the share on can see in the daily graph below that the rising EMA9 make up the first level of support. The next levels are 308 USD/share and a rising MA20.

Oil enjoys the trade sentiment
The Saudi Arabian state is now alleged to do everything to raise the price on crude oil ahead of the listing of state-owned oil company Aramco next year. The Saudis try to persuade the other Opec members to limit their oil production and are already themselves below their allocated quotas. So far, Saudi Arabia has not succeeded, but they have many friends and can play a high political game, including Russia, China and the United States. To sum up you should keep an eye on the oil graphs for the next few weeks.
The oil price has also been strong given the current sentiment on the Phase 1-trade deal between the US and China. Nevertheless, a strong USD has dampened the rise and the sticky fluid has not managed to break above its daily MA200 line. The next level on the upside can be found around 58.6 USD/barrel followed by 60.5 USD/barrel for WTI oil.

The chances of Iran to get its wishes fulfilled though is limited. There are a cluster of support levels on the downside where the rising trendline makes out the strongest.
Bull & Bear-certifikat
Risker
This information is in the sole responsibility of the guest author and does not necessarily represent the opinion of Bank Vontobel Europe AG or any other company of the Vontobel Group. The further development of the index or a company as well as its share price depends on a large number of company-, group- and sector-specific as well as economic factors. When forming his investment decision, each investor must take into account the risk of price losses. Please note that investing in these products will not generate ongoing income.
The products are not capital protected, in the worst case a total loss of the invested capital is possible. In the event of insolvency of the issuer and the guarantor, the investor bears the risk of a total loss of his investment. In any case, investors should note that past performance and / or analysts' opinions are no adequate indicator of future performance. The performance of the underlyings depends on a variety of economic, entrepreneurial and political factors that should be taken into account in the formation of a market expectation.