Energy is building ahead of talks


Last week was filled with economic data from the US which created volatility on the global stock markets. ISM manufacturing is a forward indicator which for the second reading in the row came in below 50 – meaning contracting activity. ISM non-manufacturing is still above 50 but the trend is clearly downward sloping.
Last week was filled with economic data from the US which created volatility on the global stock markets. ISM manufacturing is a forward indicator which for the second reading in the row came in below 50 – meaning contracting activity. ISM non-manufacturing is still above 50 but the trend is clearly downward sloping. The two figures added to the already existing worries about the economic outlook in the wake of the trade war between the US and China. Friday's job figures in the United States came in somewhat lower than expected, but with a positive revision of the two previous months it turned out to be a positive net result. Unemployment, which is a completely different survey, dropped to 3.5 percent, the lowest level in 50 years. The only glum was that wages did not rise.
Today, the new round of trade negotiations between the US and China starts at medium level. On Thursday-Friday, negotiations are lifted to the next highest level when China's Deputy Prime Minister Liu He meets with US negotiator Robert Lighthizer and US Treasury Secretary Steven Mnuchin in Washington. It will be the days ahead of the weekend and the weekend when it can crack up properly. However, the week will of course be filled with rumors when the parties will leak well-chosen parts from the negotiations to influence the markets and favor their own negotiating position.
Not only do the trade talks reach their crescendo during the next weekend. In addition, the Q3 reporting season strikes on a broader front with reports from the US banks starting on Tuesday the 15th with Citigroup, JP Morgan, Wells Fargo, etcetera.
The daily graph for S&P 500 below shows how things are getting tighter between support and resistance levels, which indicates that the market is rebuilding energy for a larger movement. The one close above EMA9 and MA 50 calls for further upward movement towards MA20 around the 2 975-level. Worth noticing is that MACD has generated a sell-signal. Fib 50 and MA100 makes out a first downside support level:

Bull & Bear-certifikat
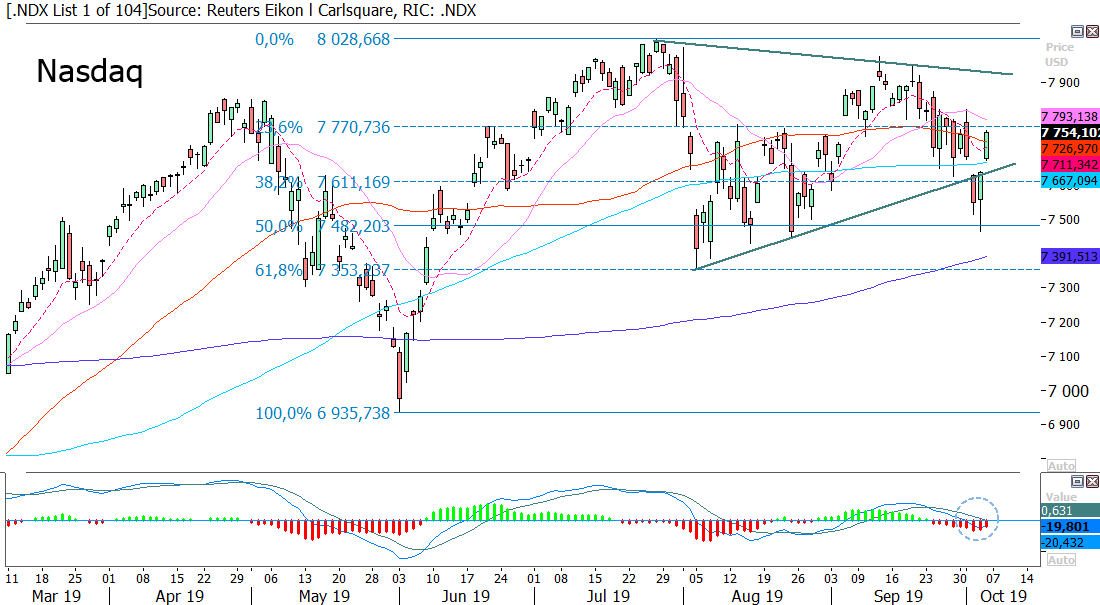
Tech-heavy Nasdaq is approaching on Fib 23,6. A break above this level and MA20 and the 7 900-level may function as a magnet and resistance. MA100, the rising trendline and Fib 38,2 function as support. Fib 50 is the next level on the downside.
Bull & Bear-certifikat
The weak ISM figures for the manufacturing and non-manufacturing figures in the United States also hit the European markets. During Thursday last week OMXS30 touched down on the Fib 50 and MA200 where the index also bounced. However, it did not manage to close above Fib 38,2. As for S&P 500 things are getting tighter between support and resistance levels. Volatility has obviously increased and is likely to remain, meaning that a break-out from these levels also can be quick and big. Above Fib 32.2 is 1 625 making out the next level on the upside. 1 550 is the next level on the downside below Fib 50.

Bull & Bear-certifikat
Trading was closed on Thursday in Germany due to the German Unity Day. Fib 50 at 11 958 is acting as a support line. After a potential break above MA50 the next level on the upside is made up by MA20 and Fib 61,8. A break below Fib 50 and MA200 and Fib 38,2 make up a first firm support level on the downside:

Bull & Bear-certifikat
Can H&M take out MA200?
During last week, Hennes & Mauritz (HM B) reported its Q3 figures. Both sales and earnings were better than expected. Online sales grew at a rate of 25% in local currency, but analysts still see the risk on the downside. However, as can be seen in the weekly graph below, the share is trading in a rising trend but weekly MA200 is meeting up from above around the 200 SEK-level. In case of a break up above MA200, the upside is relatively good up to 223.0 where the next level can be found. On the downside, 182.6 is the closest level followed by 170 SEK.

Downside risk in Apple!?
Apple has signaled for a high demand for its new iPhone. This has also pushed the share higher. However, as can be seen in the weekly graph below, the share is trading in a bearish rising wedge-pattern that tends to break on the downside calling for a larger set back. Positive is that momentum is still rising:

Worries and weaker USD strengthen gold
Worries about the economic global growth has been lingering and strengthened the demand for gold as a hedge. However, the stronger USD took out its right and the longer rising trend was broken in September. Gold bounced in the beginning of October and has now reclaimed MA50 as well as MA20. Continued concern about economic growth and a weaker USD as an effect of increasing probabilities for a Fed rate cut at the end of October may continue to drive gold in the short term. The next level on the upside is 1 520. Fib 23,6 makes out the first level of support on the downside.

Mini Future
Risker
This information is in the sole responsibility of the guest author and does not necessarily represent the opinion of Bank Vontobel Europe AG or any other company of the Vontobel Group. The further development of the index or a company as well as its share price depends on a large number of company-, group- and sector-specific as well as economic factors. When forming his investment decision, each investor must take into account the risk of price losses. Please note that investing in these products will not generate ongoing income.
The products are not capital protected, in the worst case a total loss of the invested capital is possible. In the event of insolvency of the issuer and the guarantor, the investor bears the risk of a total loss of his investment. In any case, investors should note that past performance and / or analysts' opinions are no adequate indicator of future performance. The performance of the underlyings depends on a variety of economic, entrepreneurial and political factors that should be taken into account in the formation of a market expectation.