Watch the oil price in case of a zero-covid pivot


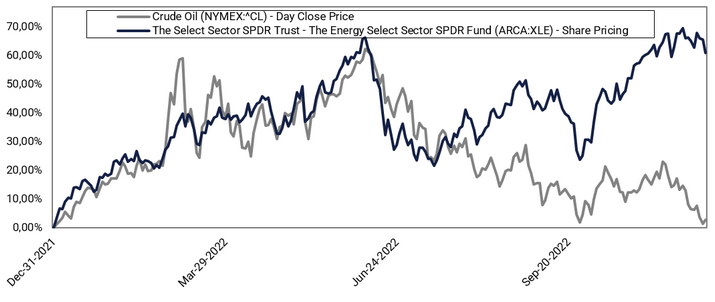
Since the early summer of 2022, the oil price has been in a general slump and has subsequently given back the gains from the first half of 2022, that were fuelled by, e.g., the war in Ukraine and the ensuing energy crisis in Europe. The development is in sharp contrast to shares in energy companies which have performed well so far in Q4. The XLE Energy Sector ETF which tracks an index of US energy companies is also at eight-year highs currently. Some drivers behind the weakness in the oil price have likely been monetary tightening and recession fears in the US and Europe, as well as the lockdowns in China.
Crude Oil price (in USD) vs XLE Energy Sector ETF (USD)
Regarding China, we note that Chinese stocks have outperformed in the recent month. This even as new covid cases have surged and as the enforcement of severe zero-covid policies continues, harming growth prospects. Hence, there seems to be increasing hopes, at least among equity investors, that Beijing will soon adopt less restrictive measures. In the last week, there have been reports of anti-lockdown protests in major cities in China. While abandoning the zero-covid stance might humiliate leader Xi Jinping, it could be a necessary price to pay for social stability. The balancing act is to spin a policy pivot as a success for the government.
Perhaps a “Xi pivot” is what investors should look for rather than a “Powell pivot”? A change in covid policy will take some time to play out in the real economy but will likely push commodity prices higher.
Brent Crude Oil (in USD), daily 12-month price chart
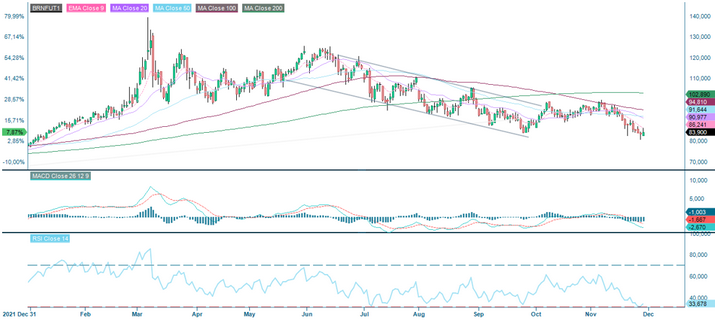
The oil price is in a negative trend but appears to be in a consolidation pattern and over-sold. However, there are no apparent signs of a bottom yet, and there might be further downside in the near term, e.g., continued hawkishness from the Fed (the next Federal Open Market Committee (FOMC) Policy meeting is on 13-14 December). Then again, policy signals from China could lead to a quick reversal. The prospect of another Chinese New Year in lockdown is undoubtedly not an enticing one, and the approaching holidays could press Xi to act.
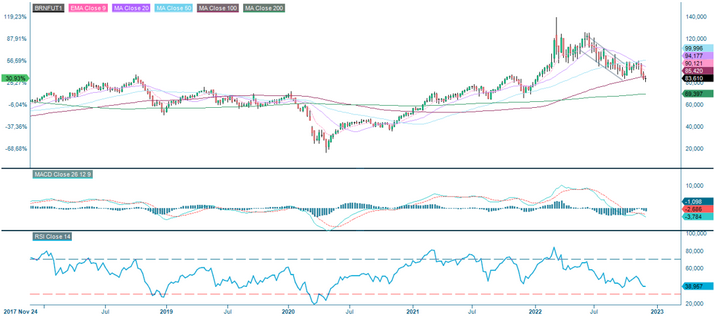
Brent Crude Oil (in USD), a five-year chart from November 2017 to November 2022
Bull & Bear-Certificates
The full name for abbreviations used in the previous text:
EMA 9: 9-day exponential moving average
Fibonacci: There are several Fibonacci lines used in technical analysis.
Fibonacci numbers are a sequence of numbers in which each successive number is
the sum of the two previous numbers.
MA20: 20-day moving average
MA50: 50-day moving average
MA100: 100-day moving average
MA200: 200-day moving average
MACD: Moving average convergence divergence
Risks
This information is neither an investment advice nor an investment or investment strategy recommendation, but advertisement. The complete information on the trading products (securities) mentioned herein, in particular the structure and risks associated with an investment, are described in the base prospectus, together with any supplements, as well as the final terms. The base prospectus and final terms constitute the solely binding sales documents for the securities and are available under the product links. It is recommended that potential investors read these documents before making any investment decision. The documents and the key information document are published on the website of the issuer, Vontobel Financial Products GmbH, Bockenheimer Landstrasse 24, 60323 Frankfurt am Main, Germany, on prospectus.vontobel.com and are available from the issuer free of charge. The approval of the prospectus should not be understood as an endorsement of the securities. The securities are products that are not simple and may be difficult to understand. This information includes or relates to figures of past performance. Past performance is not a reliable indicator of future results.