Up, up and away


With support from the companies' earnings outcome from their Q3 2019 reports and positive tones from the US-China trade talks, the S&P 500 tested at an all-time high last Friday. Another underlying driver may come from the US Fed, which daily pumps new liquidity into the system.
With support from the companies' earnings outcome from their Q3 2019 reports and positive tones from the US-China trade talks, the S&P 500 tested at an all-time high last Friday. Another underlying driver may come from the US Fed, which daily pumps new liquidity into the system.
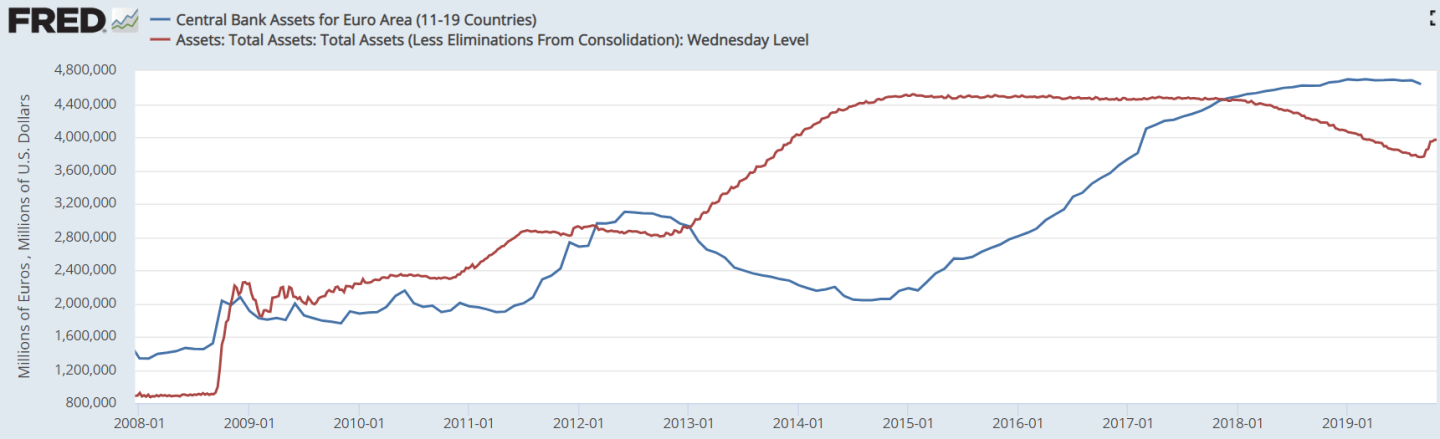
The graph above shows the total assets of the central banks. The blue line illustrates injections from the central banks of the EU countries which are leveling out. The red line shows how the US Fed's assets at first level out but then declines and now suddenly increases again. It is unclear why this is happening, but we have previously pointed out that liquidity in the US has decreased. One reason why the Fed is currently injecting new money into the system is that they are trying to rectify this quickly. Other reasons mentioned in the speculations are that European banks are raising capital for a quick Brexit, as several large European banks otherwise might have to throw in their towels. Time will tell and it is positive from the market's perspective that the central banks are on their tippy toes. A quick set back in the market and fresh money will be pumped into the system. The same - new capital flowing into the markets and seeking the highest return, which currently is found on stock and junk bonds.
S&P 500 closed right below its previous high from July as shown in the graph below. In case of a break on the upside one may extend the Fibonacci sequence to find the next resistance level slightly below the 3 100-level. However, one should note the negative divergence between MACD and the index. In case of a break below EMA9 and the floor of the short rising trend a cluster of support levels meet up between 2 965 and 2 950 where MA20, MA50 and MA100 can be found:

Bull & Bear-Certificates
Tech-heavy Nasdaq closed the week on a new all-time-high by just a few index points. Once again, by extending the Fibonacci sequence the next level of resistance can be found around 8 282. Company reports are likely to continue to move the market also this week in the US. Alphabet (Google) will release its report today after closing. Facebook is another big company that can move the stock market that will release its report on Wednesday after closing. Alibaba will release their figures on Friday. In case of a setback, the first level of support is made up by EMA9. The next support level is found around 7 825 and MA20 around 7 810.

Bull & Bear-Certificates
Last week from 21 to 25 October another 125 S&P 500 companies have released their Q3 2019 reports (or corresponding periods). Since more results have landed the proportion of company results ahead of analyst´s earnings estimates have decreased from 82 to 75 per cent, which still is a very good number though. When it comes to revenue outcome the share of better than expected reports is lower, 60 per cent down from 62 per cent last week. The best performing sectors are the small S&P500 telecom sector with 100 per cent earnings ahead of estimates, while the positive surprise rate for the much larger Technology sector amounts to 86 per cent.

OMXS30 on new ATH, where to next?
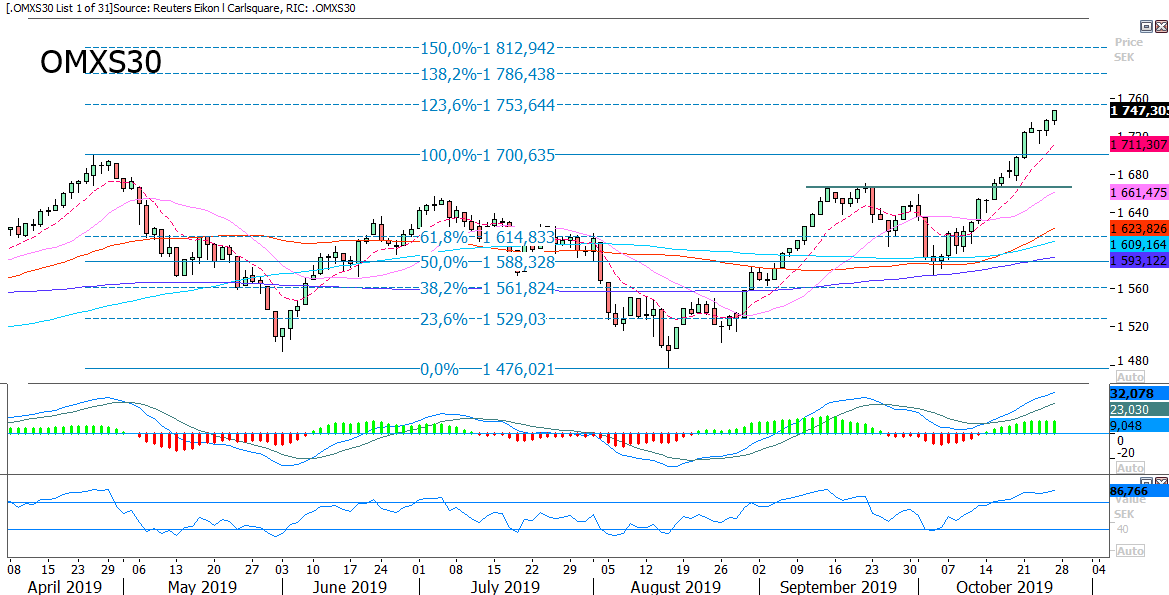
Swedish OMXS30 managed to closed Friday´s trading on its intraday high, well above its 1 700-level on a new all-time-high. Once again, by extending the Fibonacci sequence one may find the next levels on the upside as shown in the daily graph below. The RSI is at over-bought levels, which should be noted is not a sell signal stand alone. However, the Fib 123.6-level is catching up acting as resistance. A rising EMA9 followed by the 1 700-level makes up the first and second levels of support on the downside. In case of a break above Fib 123.6, the next level on the upside can be found around 1 786:
Bull & Bear-Certificates
German DAX is lagging behind, although the past week was strong even for DAX. The index closed above the 12 848-level and can now be looking for testing the 13 136-level on the upside as shown in the weekly graph below. Support on the downside can be found at the 12 500-level:

Nordea bounced after weak earnings but is now facing resistance
The Nordea share fell after reporting a Q3 2019 loss caused by several write downs. The largest write down are associated to immaterial IT related assets. The bank also cuts its dividend and presented new financial targets and further cost reductions.
The share opened down on the report but recovered to close the week in positive territory. In the daily graph below, one can see how the stock closed above its Fib 61.8%. However, the share did not manage to break above its MA200, deciding the long-term trend, which thus is still falling:
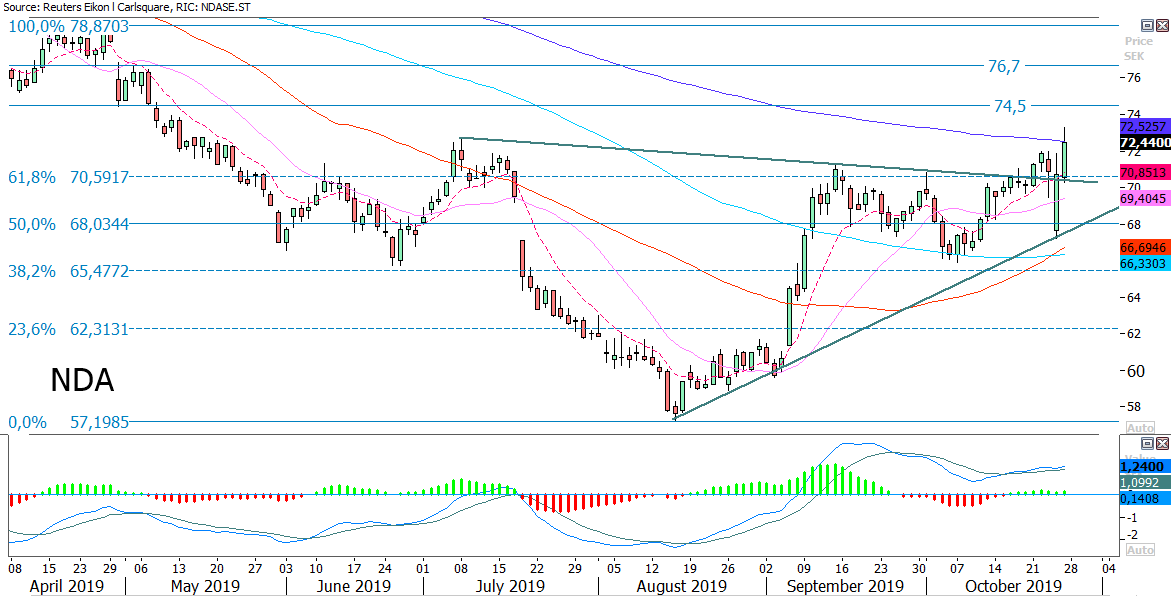
First level of support on the downside can be found at SEK 70.6 – 70.8, followed by SEK 68.0.
However, a break above MA200 in the daily graph and MA 50 in the weekly graph calls for further upside. In the weekly graph the first level of resistance can be found slightly below the 80-level.
Bull & Bear-Certificates
Tesla is flying after surprising profits
Tesla surprised the market by showing profitability and the shares rallied. As shown in the weekly graph below, the share closed above its Fib 61.8% and has taken the aim for the 330 and 340-level. MACD generated a buy signal and perhaps previous tops from Q2 and Q3 2017 can be tested.

The daily graph below shows how the share gaped up on the report. The gap was also followed by a strong Friday reducing the probabilities of the gap being closed. However, should the share turn south again, the first level of support can be found around 308, followed by the psychologically important 300-level and 283 where Fib 50% from the weekly graph above meet up.

Oil above MA20 on high US demand
Crude oil inventories fell unexpectedly in the US by 1.7 million barrels. Anticipated was a growth of 2.2 million barrels. This caused the oil price to break above MA50 as well as MA100 – now both acting as support. Oil finished the week close to Fib 38.2 around 57 USD/barrel. This level as well as MA200 needs to be broken before Fib 50% can be tested.

Strong USD may clog the oil
A strong USD may also impede the oil price. Also, the fed is widely expected to cut rates this week. However, the USD has strengthened against the euro and closed the week below EMA9. However, momentum is positive but is losing in strength. Fib 38.2% still serves as first resistance level followed by the 1,1-level where MA50 and MA20 meet up. Falling MA100 and Fib 50% serves as first and second level of resistance on the upside:

Risks
This information is in the sole responsibility of the guest author and does not necessarily represent the opinion of Bank Vontobel Europe AG or any other company of the Vontobel Group. The further development of the index or a company as well as its share price depends on a large number of company-, group- and sector-specific as well as economic factors. When forming his investment decision, each investor must take into account the risk of price losses. Please note that investing in these products will not generate ongoing income.
The products are not capital protected, in the worst case a total loss of the invested capital is possible. In the event of insolvency of the issuer and the guarantor, the investor bears the risk of a total loss of his investment. In any case, investors should note that past performance and / or analysts' opinions are no adequate indicator of future performance. The performance of the underlyings depends on a variety of economic, entrepreneurial and political factors that should be taken into account in the formation of a market expectation.