The trend towards value stocks favourable for Dow Jones


The trend of falling inflation and lower long-term interest should benefit value stocks. In recent quarters, orders have been firm for industrial and capital goods. One way to get such exposure is via the Dow Jones Industrial Index.
Major stock
markets have traded slightly lower ahead of the US Consumer
Price Index (CPI) figures for November
today and the Fed's interest rate decision tomorrow, Wednesday, 14 December.
The US Producer
Price Index (PPI) figures for November were slightly higher than anticipated, 0.3%
against expectations of 0.2%. But in annual terms, inflation in the US has
fallen from 9.7% in July to 7.4% in November 2022.
This is also
reflected in the 10-year US Treasury yield, which has declined from 4.22% on 21
October to 3.61% as of 12 December 2022.
US 10-year Treasury Yield (in %)

At the same time, order intake for industrial goods remains good in
Europe and the US, partly affected by previous major supply disruptions. One
sector that invests heavily in industrial goods is, unsurprisingly,
energy-producing companies. But the coming energy transition also drives demand
and product development in the automotive sector. Businesses have been ordering
more to ensure they receive the deliveries that have been delayed.
We believe that the current interest rate and inflation environment,
which now seems to be falling back to a somewhat more stable and lower level,
could be favourable for value stocks. That includes companies that can provide a high
and stable dividend and whose businesses also benefit from the possibility of better-operating
margins given lower input prices. Such companies are, for example, found in the
engineering and construction sectors.
Despite these developments, the Dow Jones index has fallen back
recently. We think this could offer an opportunity to invest in this index with
giants such as Apple, Caterpillar, Coca-Cola, and General Electric, plus stable
dividend stocks such as Walgreens Boots Alliance.
Dow Jones Industrial Index (USD), a daily one-year graph

Bull & Bear-Certificates
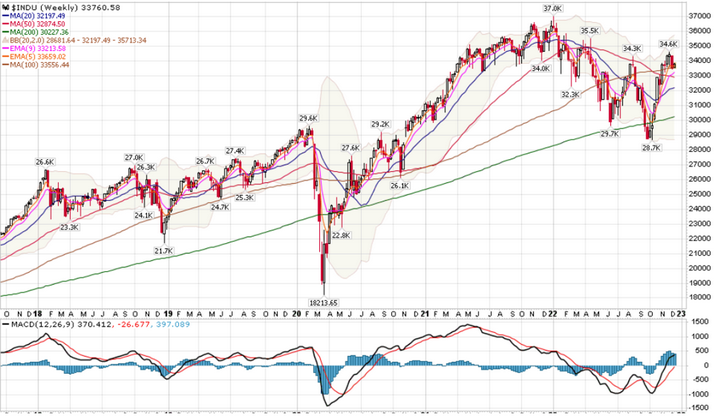
Technically, the Dow Jones Industrial does not look that strong since it has fallen below MA20. At the same time, there is support further down in the form of the MA200 and MA100.
Dow Jones Industrial index(USD), a weekly five-year share price chart
The full name for abbreviations used in the previous text:
EMA 5 5-day exponential moving average
EMA 9: 9-day exponential moving average
Fibonacci: There are several Fibonacci lines used in technical analysis.
Fibonacci numbers are a sequence of numbers in which each successive number is
the sum of the two previous numbers.
MA20: 20-day moving average
MA50: 50-day moving average
MA100: 100-day moving average
MA200: 200-day moving average
MACD: Moving average convergence divergence
BB(20,2,0): Bollinger bands is a line used in technical analysis, it is a
set of trend lines plotting two standard deviations away from the MA20.
Risks
This information is neither an investment advice nor an investment or investment strategy recommendation, but advertisement. The complete information on the trading products (securities) mentioned herein, in particular the structure and risks associated with an investment, are described in the base prospectus, together with any supplements, as well as the final terms. The base prospectus and final terms constitute the solely binding sales documents for the securities and are available under the product links. It is recommended that potential investors read these documents before making any investment decision. The documents and the key information document are published on the website of the issuer, Vontobel Financial Products GmbH, Bockenheimer Landstrasse 24, 60323 Frankfurt am Main, Germany, on prospectus.vontobel.com and are available from the issuer free of charge. The approval of the prospectus should not be understood as an endorsement of the securities. The securities are products that are not simple and may be difficult to understand. This information includes or relates to figures of past performance. Past performance is not a reliable indicator of future results.