The stock market rally continues, with a golden finger


Supported by 1.8 million new jobs created in the US economy last week and published on Friday, the S&P stock exchange gained 2.4 percent last week. The unemployment rate that in a few months went from 4 to some 15 percent, has now bounces back to 10.2 percent, which obviously is encouraging. Though momentum in job creating might be slowing down since there was 4.8 million new jobs created in June.
Supported by 1.8 million new jobs created in the US economy last week and published on Friday, the S&P stock exchange gained 2.4 percent last week. The unemployment rate that in a few months went from 4 to some 15 percent, has now bounces back to 10.2 percent, which obviously is encouraging. Though momentum in job creating might be slowing down since there was 4.8 million new jobs created in June.
We have witnessed some sort of stock market rally this summer. The S&P500 index is up by 8.1 percent since 30 June. The upturn has been rather broad which can be illustrated by the Dow Jones Index having performed particularly strong as of lately. Although the well-known names in the tech-heavy Nasdaq index are still very much on the news agenda, Nasdaq is not singly driving this stock market race anymore.

Signs of a second wave of Corona in important US states such as California, Florida and Texas have not worried investors at all. Meanwhile the tension between the United States and China is on the rise. We already had the US sanctions on Hongkong for being ruled by Beijing in a suppressive way when it comes to democratic rights. This was last week followed by a presidential order by Donald Trump banning all transactions for US individuals and corporates with Tencent´s WeChat app as well as ByteDance`s Tiktok. One reason for doing this now might be the upcoming presidential elections, which is less than 100 days away, with Democratic Party challenger Biden in what seems to be a solid lead but where Trump has gained back a few percentages of the voters as of lately according to www.realclearpolitics.com.

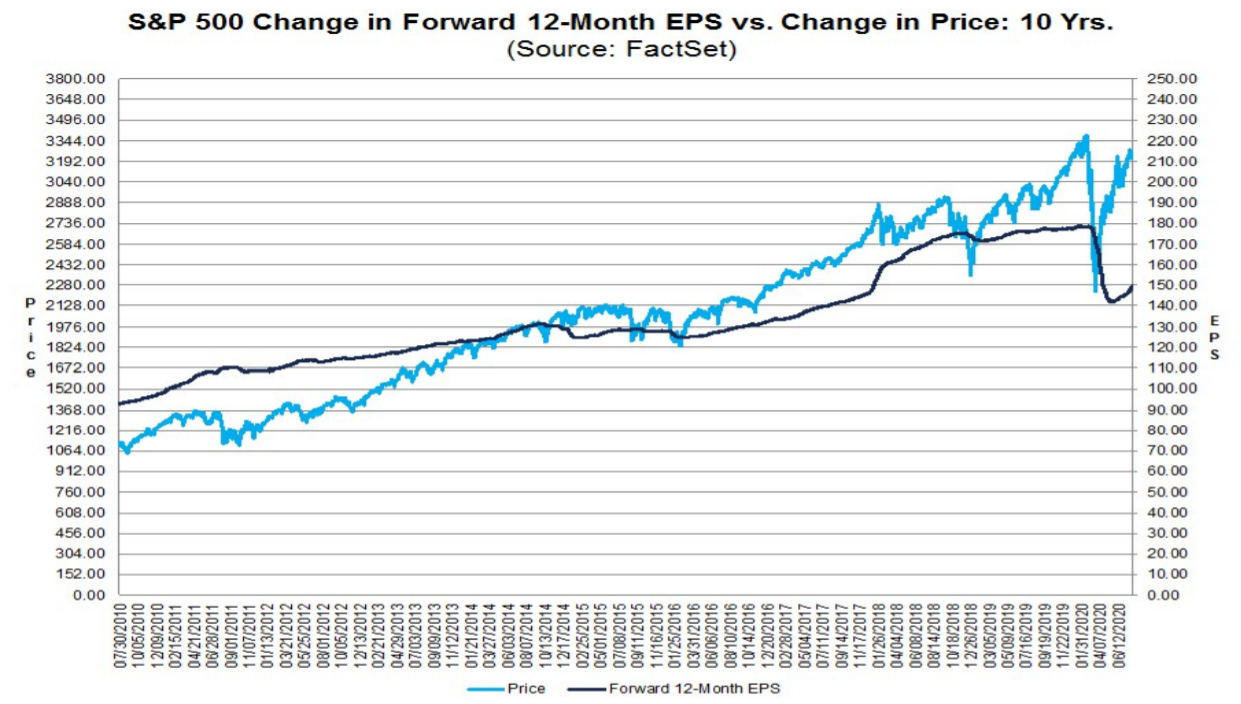
As shown in the graph above, S&P 500 is getting close to the previous top from February. The gap has been closed as the index is trading well above rising EMA9 as well as MA20. Thus, previous top seems to be in reach.
Mini Futures
Tech-heavy Nasdaq has since long broken above its previous tops from February. As shown in the graph above all moving averages are pointing upwards. Let the trend be your friend has been the winning concept.

As we have written numerous times, the central banks have supported the stock market rally. It is as the Coronavirus effect on the global economy should have no implication on the economy at all. The US GDP declined by 33 percent in Q2 2020, which is a steeper decline than any comparable period in near-time history. Now we are waiting for a V-shaped recovery that the stock market implicitly anticipates. The question is how the market would react on any delay in such a recovery?

If we proceed to US corporate earnings according to Earnings Insight Factset, the S&P500 companies saw estimated earnings decline of 44 percent in Q2 2020 as of 30 June. Meanwhile the forward P/E-ratio for the S&P500 has increased to 22.0, which is above both the 5-year-average of 17.0 and the 10-year-average of 15.3. In a fundamental way stocks on the New York exchange are more expensive than it has been for many years. On a positive note though, analysts have now increased their earnings forecast for S&P500 companies for Q3 2020 for the first time since Q1 2018, although by a meagre 1.1 percent.
The gold price has improved sharply so far this year. As shown in the quarterly graph below, gold has never been trading at these levels before.

A weak USD combined with a desire for a hedge versus the stock market and the eroding real value of currencies in the wake of the gigantic central bank programs could explain the positive momentum. But the performance in July has been exceptional and gold is at overbought levels. A slight bounce back may not be an entirely unlikely scenario. First level of support is found at the psychologically important 2 000-level and rising EMA9. In case of a break below these levels, another support can be found around 1 975:

The Swedish Krona has strengthened significant to 10.31 against the Euro and to 8.73 versus the USD. Meanwhile the EUR has also strengthened relative to the USD from 1.12 as of 30 June to 1.18 on August 6. One thing explaining the strong SEK might be the comparative good Swedish GDP outcome in Q2 2020, down with only 8.6 percent. This is of course a huge decline, but relative less than many other countries. The Swedish Government more relaxed policy with no sharp lockdowns during the main phase of the Corona crisis from March to May 2020 might have played a role here.

However, as shown in the graph above, EUR/SEK has managed to break above EMA9 as well as MA20 meaning that the short-term trend is once again rising. Also, MACD has generated a weak buy-signal. A first support can be found around 10.35 followed by MA50 meeting up at 10.40.
Companies selling in Euro or USD and having costs in SEK are disfavored by a stronger SEK. OMXS30 is also trading relatively far from its previous top in February under weakening momentum visualized by a falling EMA9. Also note how MACD is close to generate a sell signal. Last week the index also broke below MA20 but closed Friday’s trading right above a support around 1 725. In case of a break to the downside, the drop is limited to MA50 serving as a second level of support around 1 707 followed by MA100 and Fibonacci 61.8 at 1 708 respectively 1681:

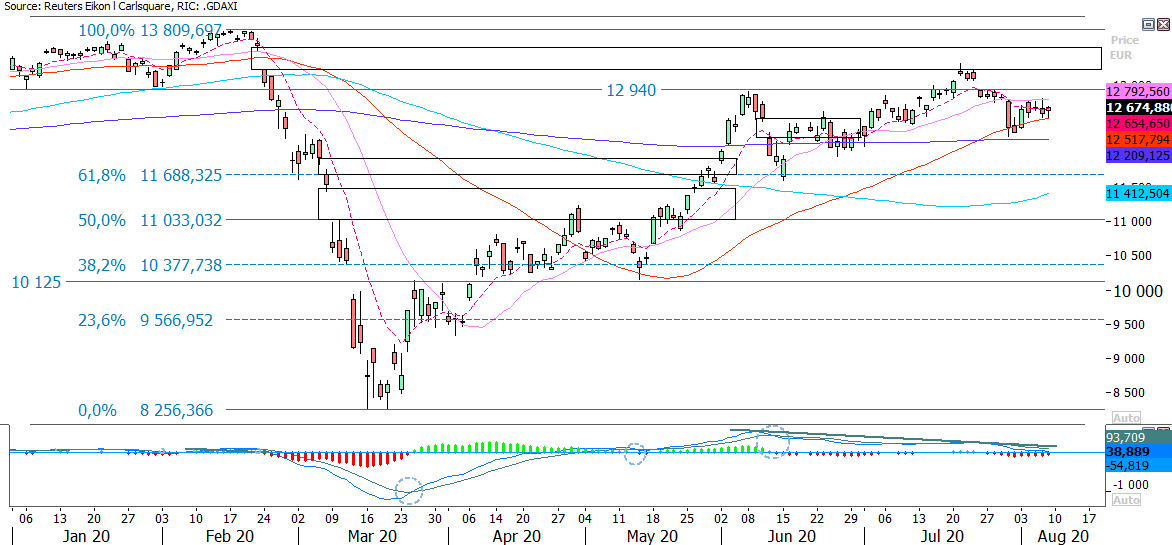
German DAX has also been trading pretty much sideways during the summer. Again, momentum is weakening and as shown in the graph below, MACD is close to generate a sell signal. DAX is now trading at a support made up by rising MA50 at 12 517. MA100 at 12 209 serves as a second support followed by Fibonacci 61.8 around 11 688:
Bull & Bear-Certificates
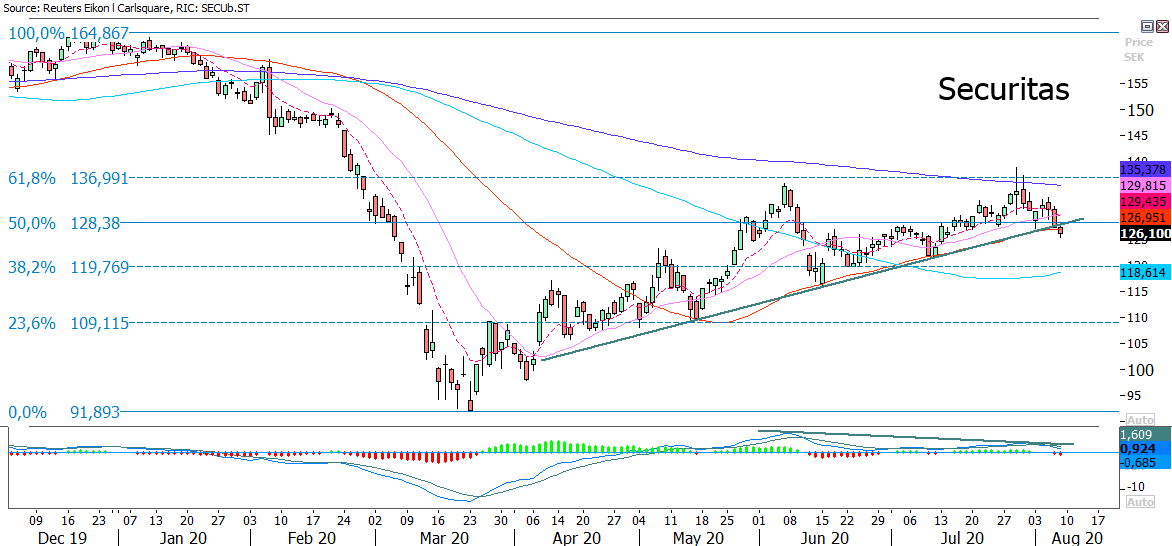
The Swedish share Securitas looks like an interesting short case from a technical point of view. As shown in the daily graph below, the share closed Friday’s trading below the rising trendline as well as MA50. The next level on the downside can be found between 118-120, where MA100 and Fibonacci 38.2 meet up:
Risks
This information is in the sole responsibility of the guest author and does not necessarily represent the opinion of Bank Vontobel Europe AG or any other company of the Vontobel Group. The further development of the index or a company as well as its share price depends on a large number of company-, group- and sector-specific as well as economic factors. When forming his investment decision, each investor must take into account the risk of price losses. Please note that investing in these products will not generate ongoing income.
The products are not capital protected, in the worst case a total loss of the invested capital is possible. In the event of insolvency of the issuer and the guarantor, the investor bears the risk of a total loss of his investment. In any case, investors should note that past performance and / or analysts' opinions are no adequate indicator of future performance. The performance of the underlyings depends on a variety of economic, entrepreneurial and political factors that should be taken into account in the formation of a market expectation.