The anatomy of a possible bottom


Both tops and bottoms can display recognizable patterns. Being aware of this can be an important tool for timing.
Studying tops, bottoms, trends, and trend changes is a major topic in technical analysis. Describing it fully fits better in a book than in an article. In these times, however, there are many (including me) who sit and watch the market and look for signs of a tradable bottom. Simply looking for a reasonable level to take on new positions, with an assumed good risk reward. What can you look for? Well, such a bottom can have a certain "anatomy” and being aware of this can be helpful.
Let me first say that there is a difference between a bottom and the bottom. What ends up being the final low in a bear market will only be known in hindsight. Negative phases in a market can be longer and deeper than most traders think. Along the way, however, there may be many tradable bottoms that provide good opportunities for a trader. This article is a description of such a possible setup.
V, U, W or “box” shaped bottom
The classic V-shaped bottoms where prices go straight down and then straight up again in my experience occur more frequently in a bull market than a bear market. In a bullish phase most bottoms are short and get bought quickly. They may also take the form of a real panic bottom where shares are dumped and forcibly sold on a large scale. Such bottoms can be V-shaped in both bull and bear markets.
More often, however, one sees that a bottom is not a single point (as in the V-shaped version), but rather takes the form of a longer process that can take many forms. It can often look like a U, W, a "box" or a wedge. The point to note is that prices go through a period of consolidation, and that a trader can take a signal from this depending on which end it breaks out of the consolidation. Let's look at the current situation in the NASDAQ 100 as an example and go through it in two charts.
Current example
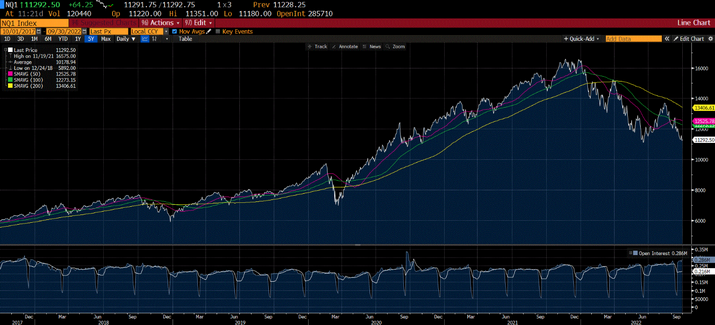
Chart 1 shows daily candlesticks for NASDAQ 100 futures (in USD) so far this year. We see that the index is in a downtrend since it is drifting lower below its 200 (blue curve), 100 (yellow), 20 (light grey) and 8 (dark grey) moving averages. We also see that in the last few days the NASDAQ has touched and reversed at the same level as in June. This formation is called a "double bottom” and is a possible technical bottom formation.
At this level, the index has moved sideways in a relatively narrow box for a few days. This is consolidating price behavior, and which way the index chooses to break out of the box will give signals about further direction. All of this is relatively logical. However, we also see that the index tested its 8-day moving average from the underside the previous day and has so far been rejected at this level (red candlestick today). This is not bullish price behavior, but we must remember that we are in a bear market. Let's zoom in a bit on chart 2, and I'll comment below the chart.

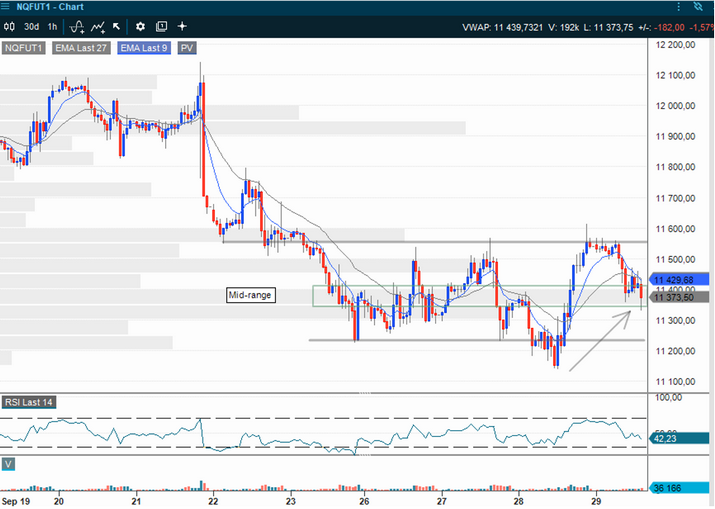
In chart 2 we see the same futures contract but shown with 1-hour candlesticks. Please note that index futures on NASDAQ are traded 23 hours a day, so there will be a lot of data. Some choose to include only the period when the US is open, but I prefer to show everything, as these instruments can be traded with good liquidity all day. Vontobel has several products that follow this and the other index futures.
Knock-Out Warrants
In the picture we see the same trading range as in chart 1 but zoomed in to smaller resolution. We also see that the top and bottom levels of the trending rank typically have been tested several times. We can sometimes see a quick spike (wick on candlesticks) up or down through this level, but we also see a period where the index was a couple of hours below the bottom level. This is relatively normal technical behavior. Traders may call it a liquidity trap, stop-loss hunting, or similar. The trick is to be light on your toes at these levels when trading. If there is an established break, you often see a continuation of the trend in the direction of the break, and the movement can come quickly.
I have also marked the middle of the box with a narrower green square that illustrates the middle of the trading range. After yesterday's strong price behavior (long blue candlestick in chart 1), many probably thought we would get a follow-up today. In chart 2, we see that prices have fallen back to the middle of the trading range again. If one is to have any faith in a breakout scenario, prices should preferably not go lower than the middle of the range in such a set-up. The next step will then be to wait for the short moving averages to be broken on the upper side, and for the top of the box to eventually be taken out. If the middle of the range does not hold, a test of the bottoms will quickly come into play. If then the bottoms are broken, it is a new strong negative signal about a continuation of the downtrend.
The reason I chose to highlight this chart was that it shows a fairly typical behavior within trends and can provide several interesting avenues of attack for a trader. However, be aware that many professional traders and Market-Makers sit and look at the same charts. The most obvious stop-loss levels will typically be tested, which we see with the fast "wicks" on the 1-hour chart. Trading is certainly not easy, but we all know that.
It can also be mentioned that the classic
pattern described here can be repeated in both short-term and long-term charts,
thus providing opportunities for both those who trade very short timeframes and
those who are looking for the longer movements.
Disclaimer:
After many years in the brokerage industry I started my own business in 2021. I
published the book "Paleo Trading: How to trade like a Hunter-Gatherer”
and launched a hedge fund that trades according to the principles described in
the book. Vontobel asked if I would write posts for their blog, similar to what
traders and managers do in other countries. I must emphasize that nothing
written on this blog is to be regarded as personal advice or a concrete call to
take positions. Everyone must be responsible for their own decisions and
familiarize themselves with the products they use.
This information is neither an investment advice nor an investment or investment strategy recommendation, but advertisement. The complete information on the trading products (securities) mentioned herein, in particular the structure and risks associated with an investment, are described in the base prospectus, together with any supplements, as well as the final terms. The base prospectus and final terms constitute the solely binding sales documents for the securities and are available under the product links. It is recommended that potential investors read these documents before making any investment decision. The documents and the key information document are published on the website of the issuer, Vontobel Financial Products GmbH, Bockenheimer Landstrasse 24, 60323 Frankfurt am Main, Germany, on prospectus.vontobel.com and are available from the issuer free of charge. The approval of the prospectus should not be understood as an endorsement of the securities. The securities are products that are not simple and may be difficult to understand. This information includes or relates to figures of past performance. Past performance is not a reliable indicator of future performance.