Stocks are losing momentum, but the Fed can give a boost


S&P 500 closed on a minus for the whole week for the first time in six weeks. As shown in the graph below, the S&P 500 has lost momentum in anticipation of actual progress to reach a Phase I trade agreement between the US and China. Notice MACD that has generated a weak sell-signal. There are indications that a trade deal may not be reached until the year end.
S&P 500 closed on a minus for the whole week for the first time in six weeks. As shown in the graph below, the S&P 500 has lost momentum in anticipation of actual progress to reach a Phase I trade agreement between the US and China. Notice MACD that has generated a weak sell-signal. There are indications that a trade deal may not be reached until the year end. Yet one problem with that is the increase in tariffs that Trump intends to implement on December 15. If carried through this will certainly infect the trade negotiations. However, the White House has announced that they may be willing to push these until further on to give the negotiations more time.

Worth noticing is the buying interest that appeared at day low levels during the three last trading days of last week. This created doji-like candle sticks. Positive for the rising trend is that EMA9 is still intact and MA20 is upwards sloping. Nevertheless, in the one-hour-graph below one can see how S&P 500 is under pressure trading at support levels, where a break below the 3 096-level calls for further downside to around 3 060 where the next support can be found:

December is coming up. Historically, December has also been a good month for stocks. Below you can find the average percentage move between October and December for the years 2000 to 2018 in white, along with percentage move since October for S&P 500 in orange current:
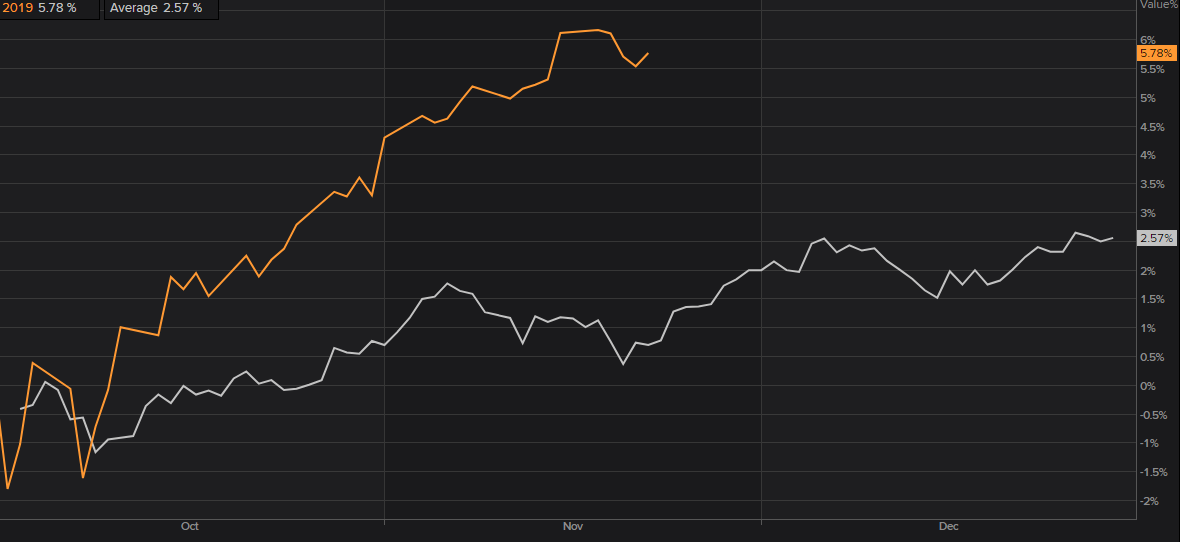
The probability of this historic pattern to reoccur also this year increase since it has so far been a good year. The reasoning behind that is called window dressing – meaning that fund managers tend to buy in to assets that has been performing strong in order to appear more attractive to investors at end of a year/quarter.
Worth noticing is also that the risk appetite rose sharply last Friday when the ETF for high yield bonds, HYG, bounced back from the resistance line:

In case of an upwards movement in S&P 500, previous top from the beginning of the past week make up the first level on the upside followed by levels around 3 140 where the second level of the extended Fibonacci sequence meet up.
Bull & Bear-Certificates
In addition to the trade negotiations between the US and China, we believe that development on the stock market to a large extent lies in the hands of the Fed. If they choose to increase their buying-activity in the coming weeks, which is likely (read more under “USD strengthen with less buying interest from the Fed”), it should also be able to provide continued support to the market.
Nevertheless, tech heavy Nasdaq is also losing momentum. The index trading close to EMA9 but above rising MA20. As for S&P 500, MACD has generated a weak sell signal. In case of a break below MA20, the next level on the downside can be found around 8 165:

Some form of resistance can be found around 8 282. The next levels on the upside is made up by the top from the previous week followed by the second level of the extended Fibonacci sequence around 8 440.
Bull & Bear-Certificates
MA20 still standing in Germany
The monthly graph for the German DAX below shows how the index has reached the upper Bollinger band. This indicates that the index has gone so strong that it has reached two standard deviations from the 20-day moving average. It is usually a natural point for reflection and consolidation:

DAX did however manage to move back up from the low of previous week supported by MA20 shown in the daily graph below. EMA9 still needs to be passed before previous top from the 7th November can be tested. But MACD has generated a weak sell signal and EMA9 is sloping downwards. A break below MA20 and the next level on the downside can be found around the psychologically important 13 000-level:

Banks causes OMXS30 to underperform
The graph below shows the year-to-date percentage performance of S&P 500 (orange), DAX (purple), OMXS30 (green), Shanghai (blue) and Hang Seng (red). Violent protests in Hongkong has put pressure on Hang Seng. There is also great risk for the trouble to escalade further. The US has showed support for the protesters which may also affect the trade-negotiations, even though it does not seem so at present.

The best percentage performance year-to-date is attained by DAX, up 24.7 percent. The Swedish OMXS30 was during the second half of October the winner, much thanks to weak SEK. But OMXS30 has now fallen behind much due to the banking sector.
As shown in the graph below OMXS30 has broken below its MA20 and EMA9 has crossed MA20 and is downwards sloping. 1 700 is the next level on the downside:

The short negative trend is also intact as can be seen in the one-hour graph below:

In case of a break on the upside of the falling trend, the next resistance level can be found around 1 750 followed by 1 778.
Bull & Bear-Certificates
USD strengthen with less buying interest from the Fed
During a shaky week for stocks, demand for US-backed intrest bearing assets increased. As a result, the US 10-year yield has fallen. The same can be seen in Europe. However, interesting statistics came in showing surprisingly that the Fed had bought less US-backed securities than expected. It is however interesting that the week when the Fed cuts off the pace, the S&P 500 backs and the US dollar strengthens. No comments have been made and since the program is fixed, the coming week could possibly compensate for last week's decline. Other than that, the information flow has been too thin to draw any certain conclusions.
As can be seen in the graph below, the USD strengthened during the last three days of previous week and the pair EUR/USD bounced nicely on the resistance around 1.108:

The next level on the downside can be found at 1.1. In case of a bounce upwards, there is a cluster of resistance levels ranging between MA50 at 1.104 and Fib 38.2 at 1.108.
Electrolux near strong support level – could bounce
Electrolux has fallen since the top in mid-October. The share is now getting close to a strong support level around SEK 235 made up by MA100, MA200 and Fib 50. Further worth noticing is that RSI signals for over sold levels. A break above MA50 and the next level that could be tested on the upside is found around SEK 253:

The RSI being at oversold levels is not a buy signal stand alone. Some sort of sign that the SEK 235-level will hold would be needed before a long position could be justified. In case of a break below SEK 235, the next level can be found slightly below SEK 229.
Bull & Bear-Certificates
Facebook has targets set on previous high
Facebook managed to cling on to levels above Fib 23.6 even though a general selling pressure on stocks took place during last week. This is a signal of strength aside from a rising EMA9 and MA20. From a technical point of view, it would not surprise if the share is about to test its previous high from July:

On the downside, EMA9 makes up the first level of support, followed by MA20 and the floor on the shorter rising trend.
Bull & Bear-Certificates
Continued volatile trading on WTI
The oil price continues to be volatile ahead of Aramco's IPO and volatile inventory statistics. In the daily graph below, one may see how the WTI oil price is trading in a shorter upwards sloping trend. MACD is rising. Fib 50 and the ceiling on the trend channel serves as resistance levels. In case of an upwards break the next level can be found slightly above 60 USD/barrel.

Continued strength in the USD may put marginal pressure on the oil price. A cluster of support levels can be found on the downside, ranging from MA200 to the floor of the rising trend channel.
Risks
This information is in the sole responsibility of the guest author and does not necessarily represent the opinion of Bank Vontobel Europe AG or any other company of the Vontobel Group. The further development of the index or a company as well as its share price depends on a large number of company-, group- and sector-specific as well as economic factors. When forming his investment decision, each investor must take into account the risk of price losses. Please note that investing in these products will not generate ongoing income.
The products are not capital protected, in the worst case a total loss of the invested capital is possible. In the event of insolvency of the issuer and the guarantor, the investor bears the risk of a total loss of his investment. In any case, investors should note that past performance and / or analysts' opinions are no adequate indicator of future performance. The performance of the underlyings depends on a variety of economic, entrepreneurial and political factors that should be taken into account in the formation of a market expectation.