Markets getting close to previous top. Now what could go wrong…


It was only a slight dip in the indices after the US-China trade negotiations heated up from China reacting to the US getting involved with the development in Hong Kong. The indices snapped up last Friday after a stronger-than-expected job report in the United States. Everyone is now looking forward to December 15, when the new tariffs will be imposed, unless the parties have reached an agreement by then.
It was only a slight dip in the indices after the US-China trade negotiations heated up from China reacting to the US getting involved with the development in Hong Kong. The indices snapped up last Friday after a stronger-than-expected job report in the United States. Everyone is now looking forward to December 15, when the new tariffs will be imposed, unless the parties have reached an agreement by then. Trump certainly feels stronger after the job figure when there was a concern that the trade war would hit the US economy, but where the turmoil largely disappeared on Friday. The question is how aggressive Trump dares to be against China now, with new confidence supporting him. Regardless of the aggressiveness of the negotiations, we are quite convinced, as is the market, that the increase in tariffs will at least be postponed. China announced last Friday that they are also lowering their tariffs on some agricultural products, so the move is going in the right direction.
With the patience of a parrot we reiterate that the upturn is strongly linked to the Fed buying government securities again in the market. They have done this net for nine consecutive weeks. The only time the stock market went down is the same week that the Fed sold net government securities.

We usually look at the total balance sheet for the Fed as a measurement. Above, this is also broken down in the form of own purchases and loans to primary dealers for their net purchases (POMO).
We note that more and more people have accepted the description of the stock exchange based on the narrative of the Fed as the governing body. This means that the monitoring of the Fed's purchase also becomes a self-playing piano. At the time of writing this, we do not understand how the Fed should emerge from this trap. It would have been natural to say that you go into neutral when you achieve the desired effect. But the need for support purchases increases with the pace of US government debt growing, so a neutral situation means parrying this increase. It may work practically but politically the scheme is absurd as it means that the Fed completely takes over the responsibility for a continued very rapid US government debt…

In the beginning of the week, Trump, informed the market that a phase 1-trade deal with China may occur soon. This improved the market sentiment significantly along with the strong labor figures from the US on Friday. S&P 500 ended up Friday up above a rising MA20 and EMA9 and is getting close to its previous top that might be tested this week. Worth noticing is MACD showing a fading momentum:

However, in the weekly graph below, a nasty hang man-like formation was created indicating a trend reversal:

A rising EMA9 and MA20 in the daily graph function as a support. Should these levels be broken the next level on the downside can be found around 3 085.
Bull & Bear-Certificates
Tech heavy Nasdaq looks similar as S&P 500 from a technical point of view, trading above its rising EMA9 and MA20 under a fading momentum. Nevertheless, the previous top from November is within reachable distance:

A hanging man-like doji was also created in the weekly graph:

EMA9 and MA20 serves as first level of support followed by Fib 23.6 around 8 215.
Bull & Bear-Certificates
OMXS30 once again in a short rising trend
The positive sentiment during the second half of last week was also seen among European investors. As can be seen in the graph below, OMXS30 managed to close Friday´s trading above MA20 meaning that the short trend is once again rising. The next level on the upside is the previous top from October/November:

Not to be forgotten is MACD, that has generated a sell signal. In case of a downward movement below MA20 and EMA9, MA50 serves as another support level right above Fib 23.6
Bull & Bear-Certificates
Swinging H&M
Last week we saw potential upside in the H&M share which now has been realized. As can be seen in the graph below, the share managed to close the gap and is now trading at resistance levels. A bounce to the downside may be the next move for the share with EMA9 and MA50 serving as a first level to be reached:

A stop can be executed right above MA50 (SEK 194.5) serving as the second resistance level on the upside.
Bull & Bear-Certificates
Further upside in Boliden after bounce?
The Boliden share bounced nicely on MA200 during last week and is not trading right below EMA9. The question is now if the gap from last week can be closed. EMA9 and MA50 serve as resistance levels before the gap can be closed:
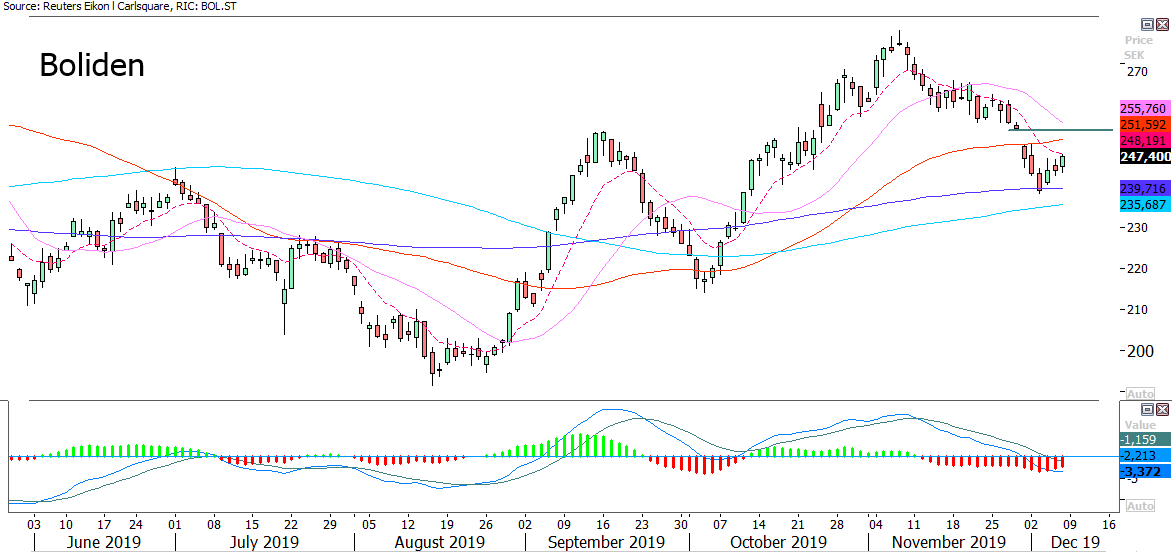
To the downside, MA200 serve as a support.
Bull & Bear-Certificates
MA20 still up for fight in DAX
The German DAX index did not manage to close above its MA20, which is still up for another round of wrestling. In case it should be broken, previous tops from October/November might be tested:
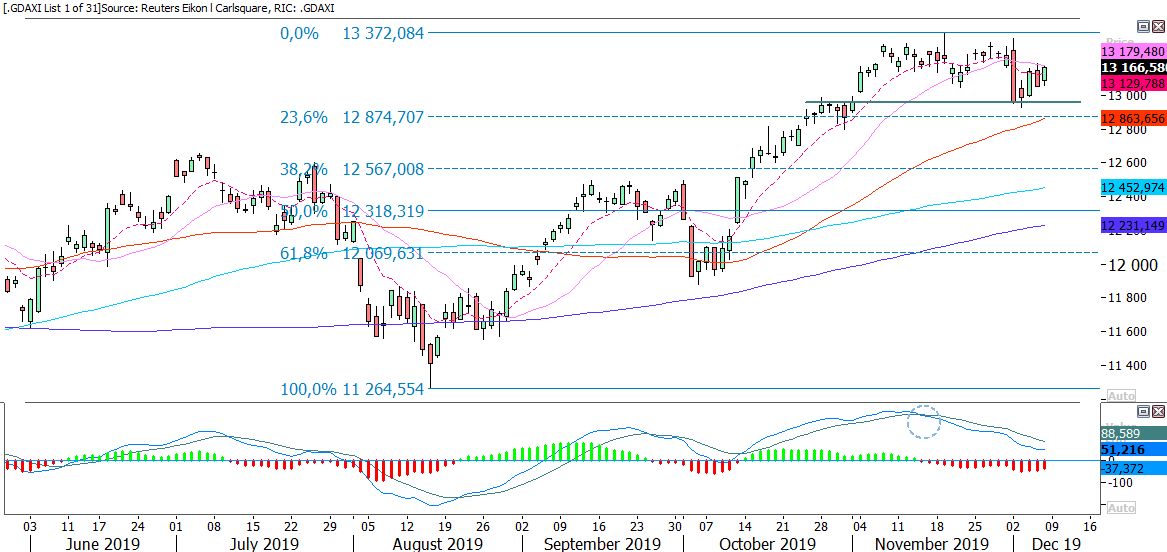
The DAX index did however manage to close above its EMA9, now serving as a first level of support on the downside. MACD is showing fading momentum. In case EMA9 is broken, the next level can be found around 12 960.
Bull & Bear-Certificates
USD/SEK below MA200
The SEK has gained strength against the USD last week and the currency pair, USD/SEK, is now trading below MA200 and Fib 61,8. The next level on the downside can be found around 9,4:

In case of increased perceived risk for a global economic setback, the SEK is likely to be vulnerable. Fib 61.8 and MA200 along with EMA9 serve as first levels of resistances on the upside. MA20 and Fib 50 comes next.
Bull & Bear-Certificates
Time for a setback in the oil price after strong week
Last week was a strong week for the oil price driven by reduced reserves in the United States. As can be seen in the graph below, the oil price managed to retake MA200 and closed Friday’s trading above Fib 61.8. The ceiling of the rising trend is getting closer serving as first level of resistance to the upside. The next level can be found around 60.5 USD/barrel:

Fib 61.8 also serves as first level of support to the downside. EMA9 and MA200 follow as the next two support Levels.
Risks
This information is in the sole responsibility of the guest author and does not necessarily represent the opinion of Bank Vontobel Europe AG or any other company of the Vontobel Group. The further development of the index or a company as well as its share price depends on a large number of company-, group- and sector-specific as well as economic factors. When forming his investment decision, each investor must take into account the risk of price losses. Please note that investing in these products will not generate ongoing income.
The products are not capital protected, in the worst case a total loss of the invested capital is possible. In the event of insolvency of the issuer and the guarantor, the investor bears the risk of a total loss of his investment. In any case, investors should note that past performance and / or analysts' opinions are no adequate indicator of future performance. The performance of the underlyings depends on a variety of economic, entrepreneurial and political factors that should be taken into account in the formation of a market expectation.