Falling momentum for US yields. Is it temporarily?


Momentum for the US 10-year Treasury yield is fading after a strong rally starting at the beginning of August. That is visualised by the falling MACD histogram marked at the bottom of the chart below.
Momentum for the US 10-year Treasury yield is fading after a strong rally starting at the beginning of August. That is visualised by the falling MACD histogram marked at the bottom of the chart below.
US 10-year Treasury yield (%), one-year daily chart

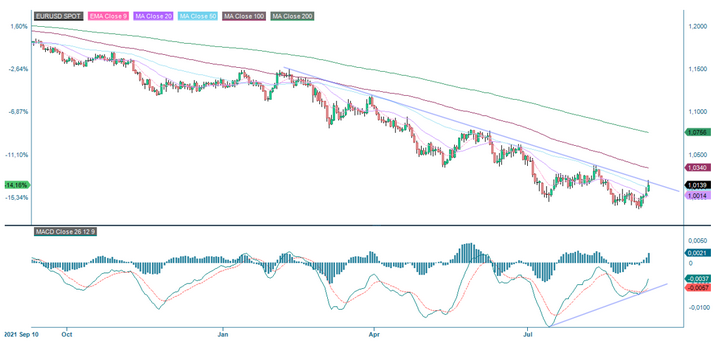
In the wake of falling momentum for the US 10-year Treasury yield, the USD has weakened against the euro.
EUR/USD (%), one-year daily chart
However, in parallel, Fed's Powell continues to express his intention to fight inflation, despite the risk of recession. An increase in the target rate by 75 points is expected on 21 September 2022, with a probability of 90 per cent. Interestingly, another 75-point increase is starting to sneak up on the table for the Fed November meeting – the market is currently discounting a rate hike of 75 basis points in November with a probability of 10.4 per cent. One week ago, the probability was zero.

Suppose the bond market continues to see an increasing probability for a 75-basis point increase in November. In that case, the weakness in the USD may be over – meaning that the purchasing power of investors holding other currencies decreases. That could, in turn, weaken commodities traded in USD, such as gold or oil.
Below is the one-year daily chart for brent oil. As can be seen, brent is under pressure, and the downside risk is quite substantial. Is the last day’s increase in the oil price an opportunity to sell?...or is the weakness in the USD only temporary?
Brent oil price (USD per barrel), one-year daily chart

Brent oil price (in USD per barrel), five-year weekly chart

The full name for abbreviations used in the previous text:
EMA 9: 9-day exponential moving average
Fibonacci: There are several Fibonacci lines used in technical analysis.
Fibonacci numbers are a sequence of numbers in which each successive number is
the sum of the two previous numbers.
MA20: 20-day moving average
MA50: 50-day moving average
MA100: 100-day moving average
MA200: 200-day moving average
MACD: Moving average convergence divergence
Risks
This information is neither an investment advice
nor an investment or investment strategy recommendation, but advertisement. The
complete information on the trading products (securities) mentioned herein, in
particular the structure and risks associated with an investment, are described
in the base prospectus, together with any supplements, as well as the final
terms. The base prospectus and final terms constitute the solely binding sales
documents for the securities and are available under the product links. It is
recommended that potential investors read these documents before making any
investment decision. The documents and the key information document are
published on the website of the issuer, Vontobel Financial Products GmbH,
Bockenheimer Landstrasse 24, 60323 Frankfurt am Main, Germany, on
prospectus.vontobel.com and are available from the issuer free of charge. The
approval of the prospectus should not be understood as an endorsement of the
securities. The securities are products that are not simple and may be
difficult to understand. This information includes or relates to figures
of past performance. Past performance is not a reliable indicator of future results.