DAX Market Analysis, September 2020

DAX index was strong in August. The index gained another ca +5% and July’s monthly candle, indicating selling pressure, was not validated. Also intra-month performance within August was quite stable, the index consolidated during one week only and all other weeks were positive.
DAX index was strong in August. The index gained another ca +5% and July’s monthly candle, indicating selling pressure, was not validated. Also intra-month performance within August was quite stable, the index consolidated during one week only and all other weeks were positive.
In US, indices were in even stronger uptrend with S&P 500 index gaining over +6.5%. This continued strong growth resulted in increasing number of market participants started to question the speed and the absolute valuations of especially FAANG shares (Facebook, Amazon, Apple, Netflix, Google). As we are writing this (September 4th) we did see first signs of market pullback, typically considered as a sign of healthy markets after a long and strong movement upwards.
From technical analysis perspective, DAX was clearly bullish in late August, so most likely scenario is that the index continues upwards with possible new all time high, as we already saw in US. Continued increase in COVID-19 cases globally does not seem to impact the sentiment in a negative way, especially as the numbers for patients in intensive care and mortality rate have fallen quite rapidly. US FED’s decision in August to allow higher inflation in USA was generally seen as a positive for stocks as the expected result fo this decision is that interest rate continue at current low levels for a long time to come (several years or longer)
As mentioned, it is natural to see pullbacks even if the market continues to go up so finding good points of entry for long trades is as important as ever. If the trend up continues, it would be possible for DAX to break previous all time high and go through level 13800. Yearly pivot R1 is then quite soon at level 14340 and most likely also 14000 is a point of resistance. If we reach R1, which is over 10% above current level (reference September 4), it is quite hard to see that we could see much further value increase for year 2020. September has been historically weak for DAX, however in current market conditions the historical averages may have less meaning than normally.
In market pullbacks, testing yearly pivot at 12350 is quite possible. Below this level, yearly EMA6 line (currently 12060) has been providing support already earlier.

Long term support levels on monthly chart: 11300, 12060, 12350
Long term resistance levels on monthly chart: 14000, 14340
Below weekly chart for DAX. Fairly performance in August shows here well, index consolidated only on one week and all other weeks were on the green. However note that mid-August onwards the candles have clear wicks/shadows above, indicating potential increasing selling pressure. Monthly pivot R1 was a clear level of resistance that DAX tested twice but failed to brake above. If the market selloff continues, one key level to follow is 12000 - it is both psychologically relevant but also if it fails and DAX breaks below, there is technically speaking plenty of space to drop more.

Medium term resistance levels: 13320, 13700
Medium term support levels: 12000, 12560, 12800
For long trades, a likely good approach is to follow the current pullback through and see where price action is stabilizing with candles indicating buying pressure (wicks below). Levels mentioned earlier work as potentia take profit points. It is quite possible that the size of the pullback is e.g. 10% from September 3 highs, this is something most would still consider normal for strong bull market.

Investor sentiment in USA has continued to bullish direction and market volatility has continued to drop. Depending on which data we look at, investors were becoming very bullish in second half of August, which many started to take as a contra indicator (market is ready for pullback).

Historically, September has been the second worst month for DAX.

Above: Split of shares in DAX-index between ones above and below their respective daily DMA20 averages. Last month we highlighted that at those levels a pullback in next 4-8 weeks has been a fairly high probability scenario. Now it looks like this view worked as a leading indicator for the pullback.

Above: McClellan oscillator continues to show levels from where we have seen market pullbacks before.
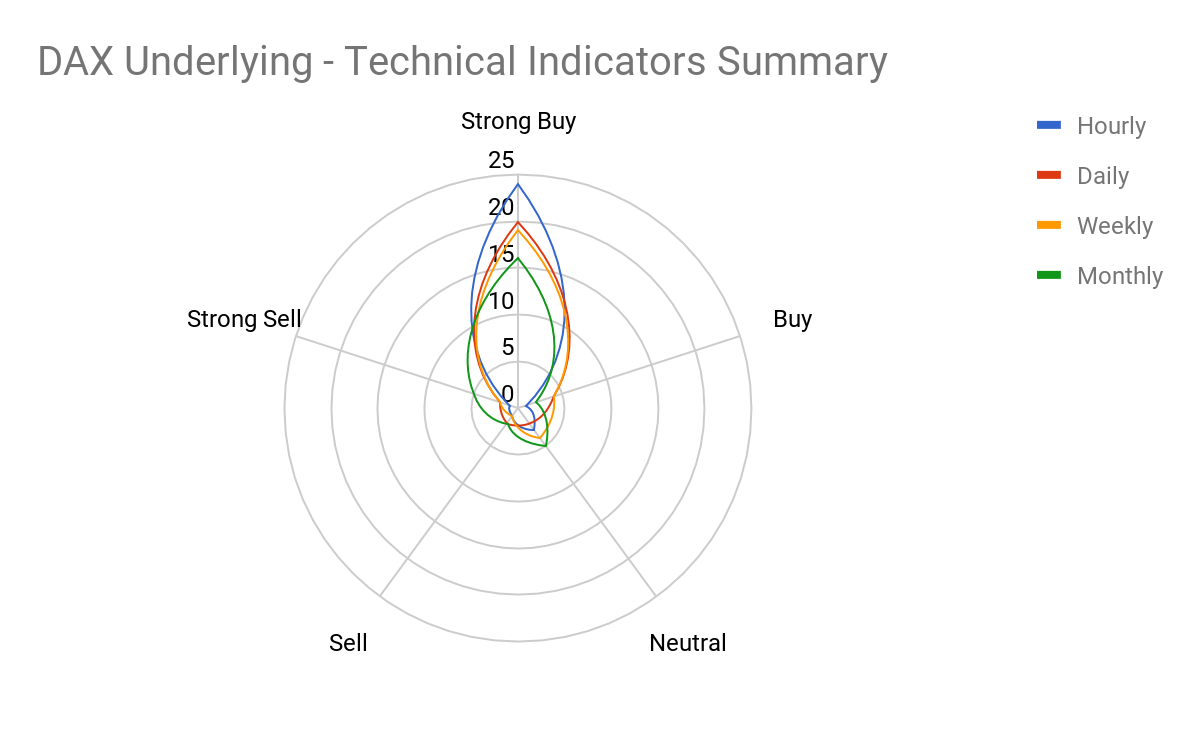
Above: Summary of technical indicators for shares in DAX index: all time frames pointing to strong buy. Such a strong bias to one direction is also often a contra-indicator for market to go the other way.


Above: Historical weekly and daily changes for DAX.

Above: DAX volatility started to increase towards late August.

Summary of world’s main futures: also here technical indicators mostly ‘strong buy’
Risks
This information is in the sole responsibility of the guest author and does not necessarily represent the opinion of Bank Vontobel Europe AG or any other company of the Vontobel Group. The further development of the index or a company as well as its share price depends on a large number of company-, group- and sector-specific as well as economic factors. When forming his investment decision, each investor must take into account the risk of price losses. Please note that investing in these products will not generate ongoing income.
The products are not capital protected, in the worst case a total loss of the invested capital is possible. In the event of insolvency of the issuer and the guarantor, the investor bears the risk of a total loss of his investment. In any case, investors should note that past performance and / or analysts' opinions are no adequate indicator of future performance. The performance of the underlyings depends on a variety of economic, entrepreneurial and political factors that should be taken into account in the formation of a market expectation.