Bottom fishing for oil in murky waters


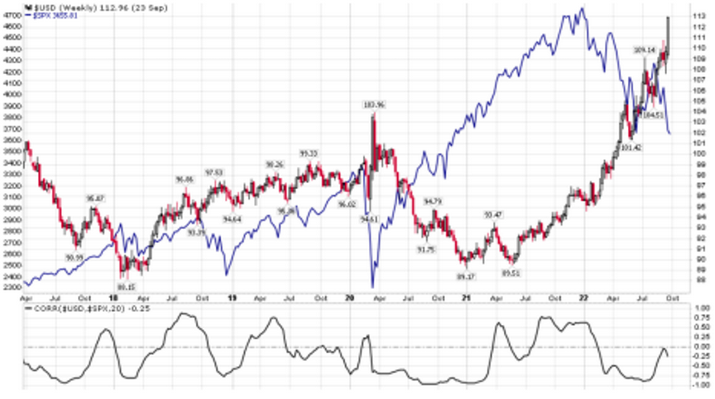
The parabolic rise in US interest rates and the US dollar is taking its toll on international financial markets. Below we show the correlation between S&P500 (SPX) and the USD.
US Dollar Index (DXY) over five years
The oil price is no exception and Brent Futures are down some seven per cent this month. Hence, the downtrend since the end of June continues. However, there have been some upward moves of around ten per cent each along the way, notably in July and August.
Brent Futures are now trading close to the floor of the trend channel and in recent days seem to have bounced off this support. Is it the beginning of another substantial countertrend move like those we have seen previously?
Brent Crude Oil (in USD), daily 12-month price chart

For this to happen the dollar is a major factor as illustrated above. At some point dollar appreciation will come to a pause, perhaps following central bank action or “Plaza accord,” however timing is hard to predict. When it happens, equity markets, but also oil, should rally.
Regardless, oil has a relative “advantage” to, e.g., equities as current geopolitical concerns should help underpin the price. There are no signs of a conclusion to the war in Ukraine yet, quite the opposite. The energy crisis in Europe continues and the supply of natural gas is constrained, to say the least. In relative terms, oil looks rather cheap.
From a technical perspective, the oil price is still in a negative trend below MA 200. We believe the level of around USD 85 is quite important as it represents the high of last year. Further below the weekly MA100 of USD 81 is a first target in a negative scenario. In a bull scenario, we see a bear market rally to USD 96 as feasible.
Brent Crude Oil (in USD), five-year chart from September 2017 to September 2022

The full name for abbreviations used in the previous text:
EMA 9: 9-day exponential moving average
Fibonacci: There are several Fibonacci lines used in technical analysis.
Fibonacci numbers are a sequence of numbers in which each successive number is
the sum of the two previous numbers.
MA20: 20-day moving average
MA50: 50-day moving average
MA100: 100-day moving average
MA200: 200-day moving average
MACD: Moving average convergence divergence
Risks
This information is neither an investment advice
nor an investment or investment strategy recommendation, but advertisement. The
complete information on the trading products (securities) mentioned herein, in
particular the structure and risks associated with an investment, are described
in the base prospectus, together with any supplements, as well as the final
terms. The base prospectus and final terms constitute the solely binding sales
documents for the securities and are available under the product links. It is
recommended that potential investors read these documents before making any
investment decision. The documents and the key information document are
published on the website of the issuer, Vontobel Financial Products GmbH,
Bockenheimer Landstrasse 24, 60323 Frankfurt am Main, Germany, on
prospectus.vontobel.com and are available from the issuer free of charge. The
approval of the prospectus should not be understood as an endorsement of the
securities. The securities are products that are not simple and may be
difficult to understand. This information includes or relates to figures
of past performance. Past performance is not a reliable indicator of future results.