SPX: Short-term weakness before the midterm rally?


Stock markets enjoyed a decent bear market rally during the summer. However, the pattern of historical seasonality may be repeating itself as S&P500 fell back (-4.2 %) in August. In September, the index stands at about 3,900, being slightly down for the month after previously rising almost four per cent.
US inflation in August was higher than expected, and the news prompted a wide sell-down on September 13 from fears of more aggressive tightening by the Federal Reserve. The ten-year rate rose to a similar level as in mid-June. At that time, the S&P 500 was down at just above 3,600. In other words, there is a continued downside in the index, all else being equal.
Historically, September is the weakest month of the year for the S&P500 (with an average return of minus 1% since 2028). While seasonality is unfavourable in the short term, there may soon be a silver lining as Q4 is traditionally the strongest quarter. This is especially true for the so-called mid-term years of the Presidential cycle. According to Bank of America, S&P500 Q4 returns in mid-term years are about 5.5 % on average, vs 2.8 per cent for Q4. When the market is already down YTD, this difference, in return, seems to be further accentuated. Of course, 2022 is, in fact, a mid-term year with US congress elections on November 8.
According to the Economist, the Democratic Party will likely gain a majority in the Senate as the party should benefit from the heated Abortion debate. The Republicans look set, however, to win the majority in the House of Representatives. We believe markets will regard a divided congress as a positive.
S&P500 index(in USD) Average Q4 returns

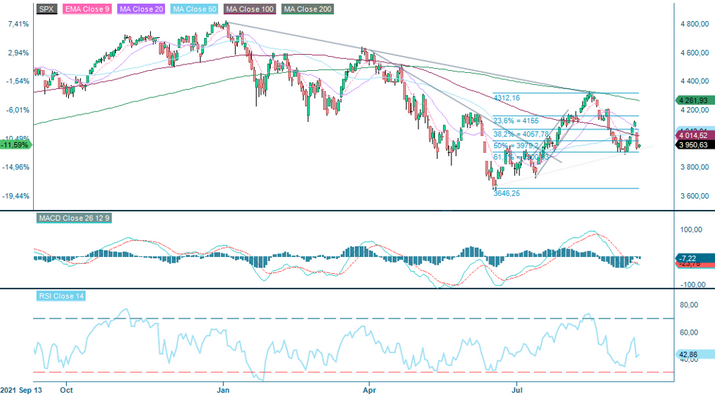
From a technical perspective, S&P 500 fell below the Fibonacci 50 level of the June to August Bear market rally, which indicates more weakness. We would watch 3,900 as an important support. If it does not hold, there is indeed a clear downside to the 3,700, and possibly 3,600, levels. On the upside, the local September top of 4,100 is a reasonable first target before a major resistance at 4,200.
S&P500 (in USD), daily 12-month price chart
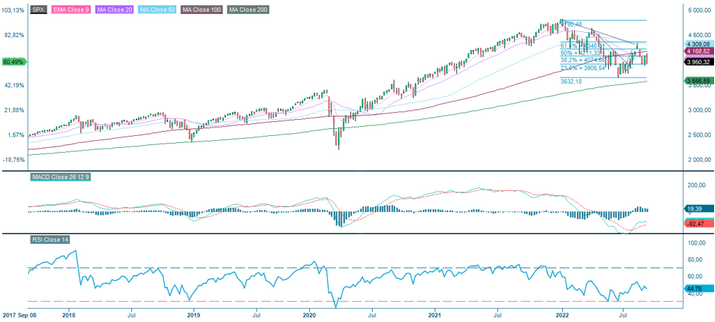
S&P500 (in USD), September 2017 to September 2022 price chart
Knock-Out Warrants
The full name for abbreviations used in the previous text:
EMA 9: 9-day exponential moving average
Fibonacci: There are several Fibonacci lines used in technical analysis.
Fibonacci numbers are a sequence of numbers in which each successive number is
the sum of the two previous numbers.
MA20: 20-day moving average
MA50: 50-day moving average
MA100: 100-day moving average
MA200: 200-day moving average
MACD: Moving average convergence divergence
Risks
This information is neither an investment advice
nor an investment or investment strategy recommendation, but advertisement. The
complete information on the trading products (securities) mentioned herein, in
particular the structure and risks associated with an investment, are described
in the base prospectus, together with any supplements, as well as the final
terms. The base prospectus and final terms constitute the solely binding sales
documents for the securities and are available under the product links. It is
recommended that potential investors read these documents before making any
investment decision. The documents and the key information document are
published on the website of the issuer, Vontobel Financial Products GmbH,
Bockenheimer Landstrasse 24, 60323 Frankfurt am Main, Germany, on
prospectus.vontobel.com and are available from the issuer free of charge. The
approval of the prospectus should not be understood as an endorsement of the
securities. The securities are products that are not simple and may be
difficult to understand. This information includes or relates to figures
of past performance. Past performance is not a reliable indicator of future results.