Renewed Covid causes the stock markets to tremble


Higher inflation is becoming apparent in Europe, with German producer prices rising at an annual rate of 18.4% in October. In addition to bottlenecks in production and supply in the business sector, higher energy prices were a significant factor behind the higher German producer prices.
In this weekly trading note from Carlsquare, we elaborate on the following topics, indices, and stocks:
- Renewed Covid causes the stock markets to tremble
- Airline and travel stocks dive on the stock exchanges
- S&P 500 is losing momentum
- Nasdaq flyting with the semiconductors
- Amazon is hot stuff ahead of Black Friday in the US
- Is the demand for USD as a safe haven currency increasing?
- Oil under pressure
- OMXS30 needs a trigger
- Can copper lead the way for Boliden
- Time to get out of DAX?
Renewed Covid causes the stock markets to tremble
Higher inflation is becoming apparent in Europe, with German producer prices rising at an annual rate of 18.4% in October. In addition to bottlenecks in production and supply in the business sector, higher energy prices were a significant factor behind the higher German producer prices. On October 31, Germany's CPI was growing at an annual rate of 4.5 percent. At the same time, a German 10-year government bond yielded minus 0.3 percent.
But some factors might slow down the pace of economic growth, like the renewed Covid wave now sweeping across Europe, mainly among unvaccinated people. 70% of the population in EU countries has taken a Covid vaccination. But the number of cases is already so high that the effects will be visible until December. Austria's government has decided to shut down the country for 20 days. In Germany, the state of Bavaria has decided to cancel its local Christmas markets. At German workplaces, only tested, recovered, and vaccinated employees have access. Employers are obliged to allow their employers to work from home, if possible. The same is true in other European countries, such as Belgium, for example.
Share of Covid Vaccinated by country in Europe, North America, Japan, and Australia

Source: Our World in Data, en.wikipedia.org.
Airline and travel stocks dive on the stock exchanges
Growing concerns about the impact of Covid restrictions brought down the New York stock market on Friday, November 19. The broader Dow Jones index fell by 0.75%, while the S&P500 lost only 0.14%. For the whole of last week, the Dow Jones fell 1.4%, while the S&P500 rose 0.3%. Tech stocks outperformed the average, which helped lift the S&P500. The Nasdaq advanced 1.2% last week.
Investors sold off on airline stocks on Friday as travel might slow again. Sectors hit hard during the peak of the Covid pandemic were restaurants, airlines, hotels, and companies supplying these sectors, including canceled events. The recovery for these sectors is now likely to be delayed. Below we can see how European Travel & Leisure stocks (Stoxx) has dipped considerably in the last two weeks
Stoxx Travel & Leisure Index from April 19 to November 19, 2021
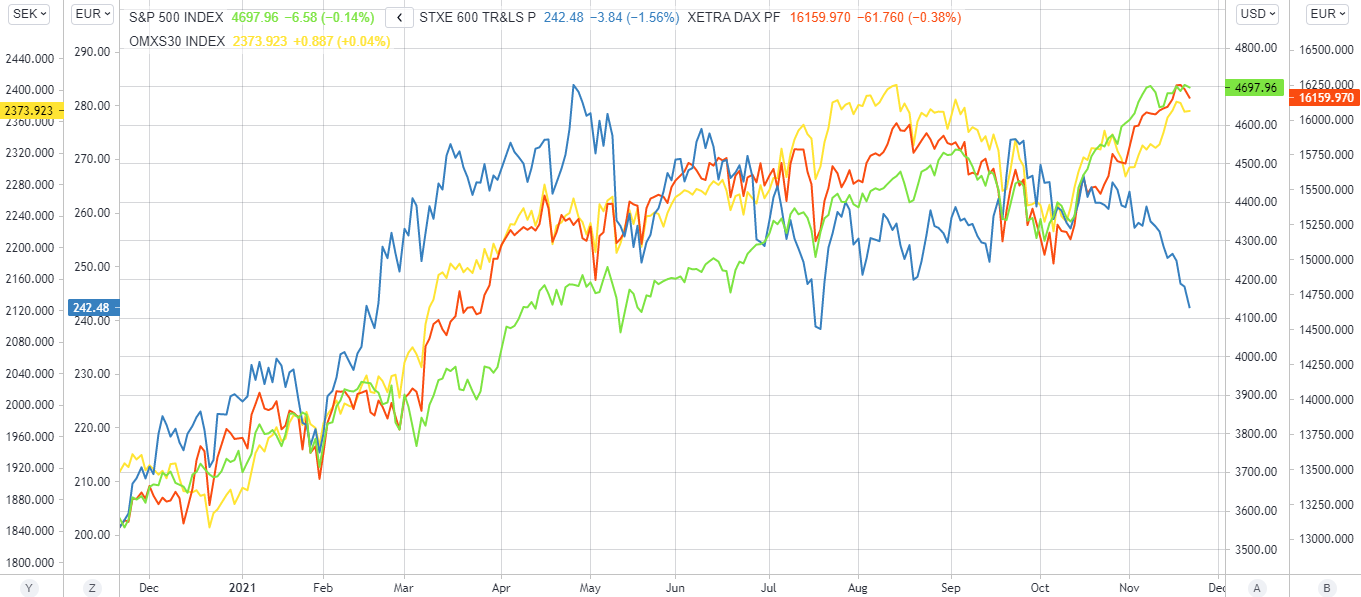
Source: Refinitiv Eikon.
If there is one thing the stock market has discounted in its price appreciation in 2020-2021, it is a recovery in corporate profits, confirmed in the Q3 2021 reports. According to Earnings Insight estimates, profit growth for S&P500 companies will slow down from Q1 2022. Whether the growth pace could be further affected by the current Covid- outbreak in Europe arises.
In any case, the interest rate market seems to believe in lower growth. US 10-year Treasury yields fell back from 1.62% to 1.55% last week. The corresponding drop in the German 10-year government bond rate was from minus 0.23% to minus 0.34%.
S&P 500 is losing momentum
S&P 500 is trading above its EMA9. However, MACD indicates that momentum is fading. In case of a break below EMA9, MA20 just above 4 650 is the next level. Can MA20 be a good level to buy the dip? Or is it reasonable to be a little more careful now, given the development of Covid?
S&P 500 Index graph, March 19 to October 22, 2021

Source: Refinitiv Eikon and Carlsquare
In the weekly graph, two Dojis in the row have been created, implying uncertainty.
S&P 500, weekly five-year price chart

Source: Refinitiv Eikon and Carlsquare. Note: Past performance is not a reliable indicator of future results.
Nasdaq flyting with the semiconductors
After the robust reports from many semiconductor companies in the US, which has boosted the SOX index. Tech-heavy Nasdaq is also performing in line with the S&P 500, thus reducing the gap.

In the daily graph, Nasdaq 100 set a new all-time high on Friday, November 19. However, a scary doji was created implying uncertainty:
Nasdaq 100 index graph, March 19 to October 22, 2021

Source: Refinitiv Eikon and Carlsquare
Nasdaq 100, weekly five-year price chart

Source: Refinitiv Eikon and Carlsquare. Note: Past performance is not a reliable indicator of future results.
Amazon is hot stuff ahead of Black Friday in the US
This week, the New York Stock Exchange looks ahead to the Thanksgiving weekend on Thursday, November 25. This weekend, the focus tends to be on retail sales linked to Black Friday on November 26 this year. There are concerns that the bottlenecks in deliveries of goods that have been ongoing since August could result in retailers having less on their shelves than usual. But at the same investor's have taken a position for strong Black Friday sales in some of the most famous retail companies, preferably with a large proportion of its sales via the web.
Stocks receiving investors' attention ahead of Black Friday are Amazon, Sears, Target, and Walmart. As shown in the chart below, Amazon is approaching the previous top from July. MACD is positive and rising. However, please note the last candle that was created on Friday. The share made an attempt to break up but failed and closed near intraday lowes.
Amazon share price graph from April 16 to November 22, 2021

Source: Refinitiv.
Amazon, weekly five-year share price chart

Source: Refinitiv Eikon and Carlsquare. Note: Past performance is not a reliable indicator of future results.
Is the demand for USD as a safe haven currency increasing?
The 10-year yield in the US fell on Friday. Nevertheless, the USD strengthened against the euro, as shown in the graph below. A possible explanation is as standard, worries about inflation, but now it may also be an uncertainty due to Covid, thus strengthening the demand for USD as a currency of safe haven.
EUR/USD graph, March 19 to October 22, 2021

Source: Refinitiv Eikon and Carlsquare
In the weekly graph, it appears as the 1.12 level may be next:
EUR/USD, weekly five-year price chart

Source: Refinitiv Eikon and Carlsquare. Note: Past performance is not a reliable indicator of future results.
Oil under pressure
Brent is under pressure and closed last week well under MA50. A stronger USD is not helping out. Also, note how MACD has generated a sell signal. Fibonacci 38.2 around 78.2 USD per barrel is the next level on the downside, followed by MA100 currently trading at 76.8 USD.
Brent oil price graph, March 19 to October 22, 2021

Source: Refinitiv Eikon and Carlsquare
In the weekly graph, EMA9 is has been broken. MA20 around 76.9 USD per barrel is next on the downside in the weekly chart.
Brent oil, weekly five-year price chart

Source: Refinitiv Eikon and Carlsquare. Note: Past performance is not a reliable indicator of future results.
OMXS30 needs a trigger
Last week, OMXS30 struggled to find direction after a strong run. On the other hand, EMA9 is still upwards sloping, and so is MACD. Thus momentum does not yet seem to give up. However, the index appears to need some trigger to break above previous highs.
OMXS30, March 19 to October 22, 2021

Source: Refinitiv Eikon and Carlsquare
OMXS30, weekly five-year price chart

Source: Refinitiv Eikon and Carlsquare. Note: Past performance is not a reliable indicator of future results.
Can copper lead the way for Boliden
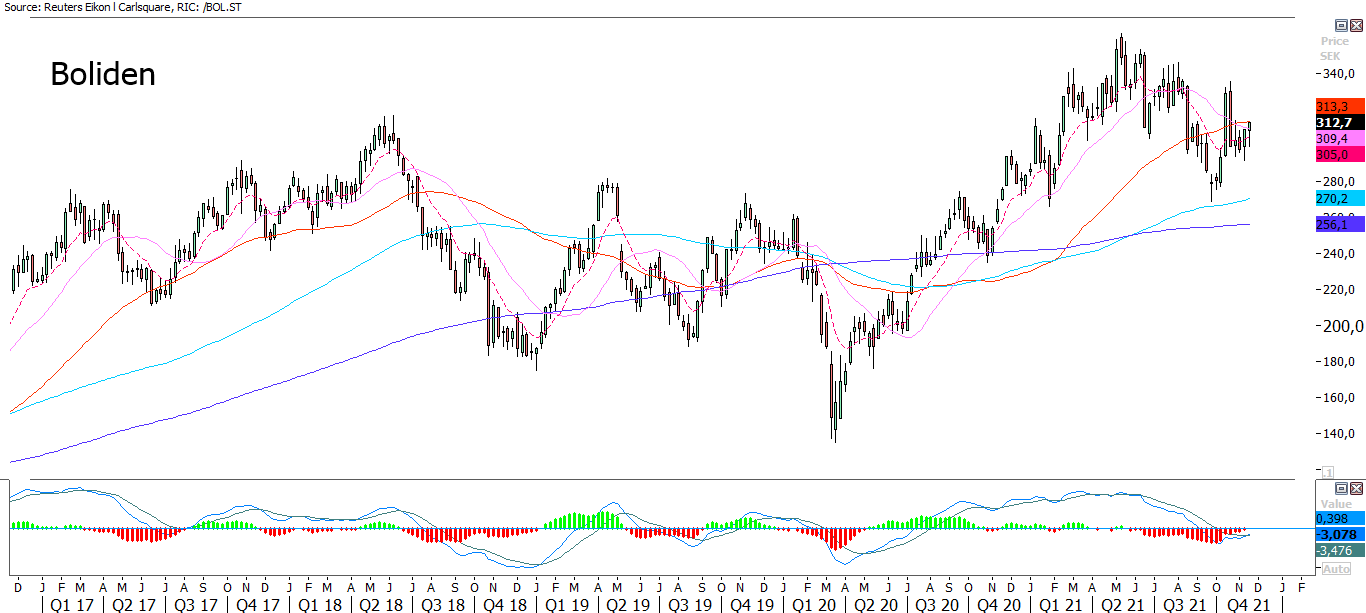
As shown in the graph below, the Boliden stock and the copper price are well correlated

The copper price is supported by a short rising trendline and closed last Friday below all moving averages. See graph below. Can copper find the strength to approach the previous top from October?
Copper price graph, March 19 to October 22, 2021

Source: Refinitiv Eikon and Carlsquare
Such a scenario would support the Boliden share price. The share closed last week above MA100 with several resistance levels ahead before the top from October can be tested. Copper is likely to decide what's to come.
Boliden share price graph, March 19 to October 22, 2021

Source: Refinitiv Eikon and Carlsquare
Boliden, weekly five-year share price chart
Source: Refinitiv Eikon and Carlsquare. Note: Past performance is not a reliable indicator of future results.
Time to get out of DAX?
DAX tested EMA9 on Friday, November 19 but failed to break down. However, as MACD signals, momentum is losing pace. In case of a break to the downside of EMA9 and the sharp rising trendline, MA20 is just above 15 980, maybe next.
DAX, March 19 to October 22, 2021
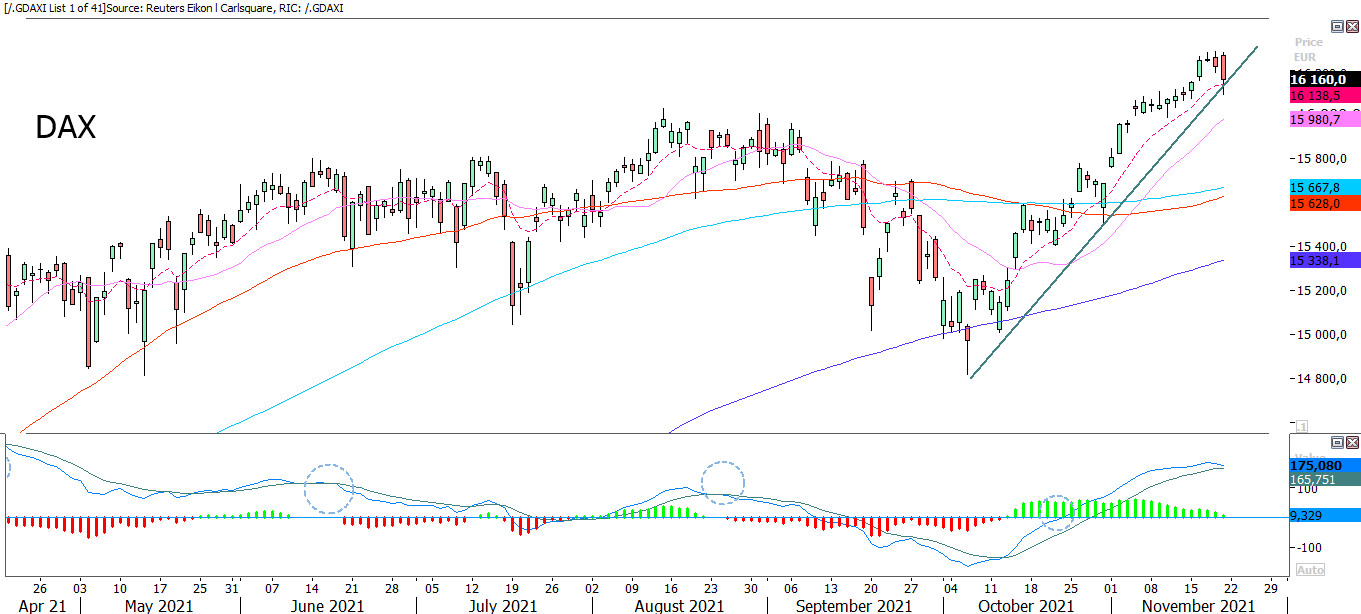
Source: Refinitiv Eikon and Carlsquare
DAX, weekly five-year price chart
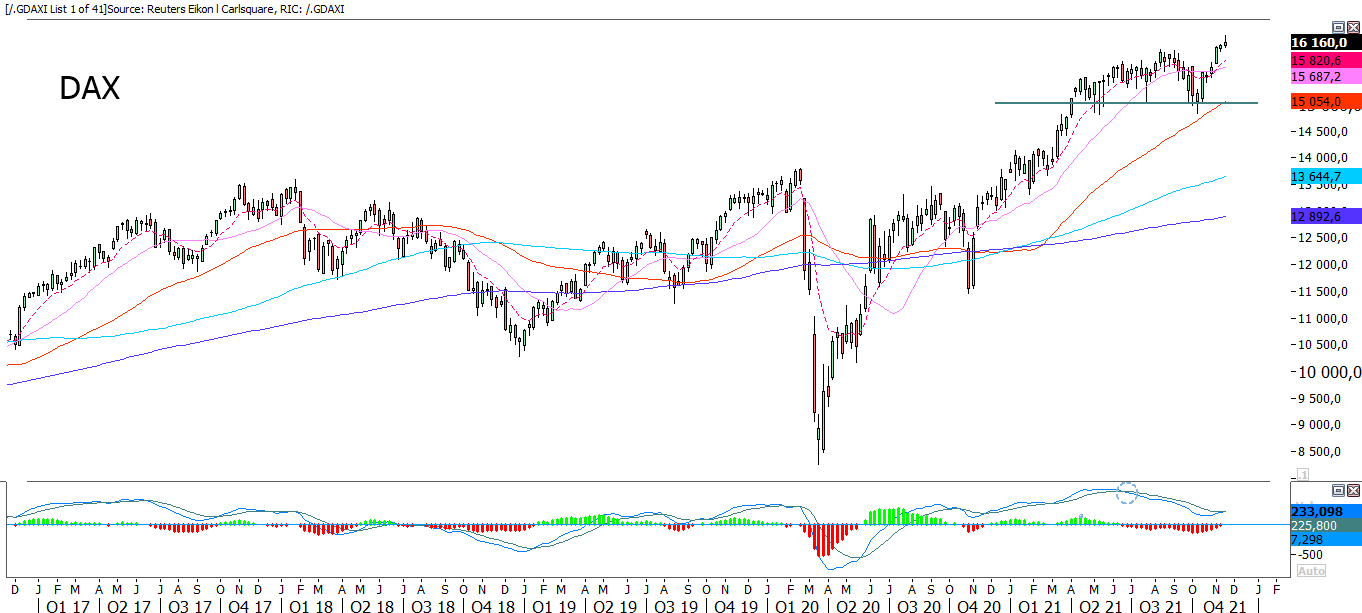
Source: Refinitiv Eikon and Carlsquare. Note: Past performance is not a reliable indicator of future results.
The full name for abbreviations used in the previous text:
EMA 9: 9-day exponential moving average
Fibonacci: There are several Fibonacci lines used in technical analysis. Fibonacci numbers are a sequence of numbers in which each successive number is the sum of the two previous numbers.
MA20: 20-day moving average
MA50: 50-day moving average
MA100: 100-day moving average
MA200: 200-day moving average
MACD: Moving average convergence divergence
Risks
This information is neither an investment advice nor an investment or investment strategy recommendation, but advertisement. The complete information on the trading products (securities) mentioned herein, in particular the structure and risks associated with an investment, are described in the base prospectus, together with any supplements, as well as the final terms. The base prospectus and final terms constitute the solely binding sales documents for the securities and are available under the product links. It is recommended that potential investors read these documents before making any investment decision. The documents and the key information document are published on the website of the issuer, Vontobel Financial Products GmbH, Bockenheimer Landstrasse 24, 60323 Frankfurt am Main, Germany, on prospectus.vontobel.com and are available from the issuer free of charge. The approval of the prospectus should not be understood as an endorsement of the securities. The securities are products that are not simple and may be difficult to understand. This information includes or relates to figures of past performance. Past performance is not a reliable indicator of future performance.