Inflation fears on a weaker stock market


We are in the period September-October, early autumn and a season when the stock market has more often than other parts of the year gone through major price falls. The prolonged rally in the S&P 500 index of plus 18.7 percent year-to-date combined with historically high valuations of corporate earnings is contributing to this.
We are in the period September-October, early autumn and a season when the stock market has more often than other parts of the year gone through major price falls. The prolonged rally in the S&P 500 index of plus 18.7 percent year-to-date combined with historically high valuations of corporate earnings is contributing to this.
What usually triggers stock market crashes are external events such as wars, but also changes in the economic outlook for the US, the rest of the western world and nowadays also the large economy in the east, China. Ahead of the Black Monday in October 1987 for example, beside an economic soft landing for the US economy 1985-1986, there had been some corporate tax legislation changes combined with high US trade deficit figures. The outbreak of the Kuwait war in August 1990, as well as 9/11, the 20th anniversary of which was commemorated over the weekend in the US, also shook the stock markets.
We do not see any such events now, other than that the US debt ceiling will probably have to be raised another notch soon plus some inflationary fears, to which we will return. So far, the price movements on the stock market look more like a correction after several months of uninterrupted rise.
The graph below shows how the valuation of S&P 500 companies' earnings (p/e ratios) has expanded since the Covid crisis began in March 2020. A short but sharp downward price decline was followed by an almost as sharp upward price rebound. By comparison, the recovery in corporate profits came with a lag, creating a valuation gap that we have now had for almost a year and a half. It is therefore justified to speak of a liquidity-driven market, in which financial support has played a greater role in the rise of share prices than corporate earnings recovery.

Source: Earnings Insight
Then there is the lifeline for the stock market – that the central banks are expected to continue their economic support and keep interest rates low. Here, US employment statistics play a role as a leading indicator. The weak job figures in August changed the perceived probability that the Fed will keep interest rates low for a while longer.
Growth expected compared to a weak quarter
We are still a few weeks away from the start of the Q3 2021 corporate result season. Expectations are high, with S&P 500 companies' profits anticipated to increase by 28 percent compared to Q3 2020. The highest expectations of an earnings improvement in Q3 2021 are found for the Energy, Materials, Industrial and Information Technology sectors.
As in the last Q2 reporting period, the comparison period is easy to beat. Optimists point to the economy returning to normal after a long period of Covid restrictions. This is illustrated by that the Wall Street analysts have revised up earnings expectations for S&P 500 companies by just over 3 percent since 30 June 2021.
Q3 2020 were marked by Covid restrictions in the US, as well as in much of the rest of the world. Events were cancelled or arranged without an audience. Restaurants had limited opening hours, maximum number of guests, etc. Office employees were to a high degree working from home. Flying anywhere was very rare. Here global flights are still only about half of the pre-Covid levels despite the societies now opening. The S&P 500 index contains a relatively large number of such service companies that were severely affected by these restrictions.
The balance between positive and negative earnings guidance ahead of Q3 2021 from S&P500 companies is quite even, 54 positives to 47 negatives so far, according to Earnings Insight. There is a clear preponderance of information technology companies with positive earnings guidance ahead of Q3. For other sectors, the picture is more mixed.
Inflation is ticking up
One issue is whether rising inflation could lower corporate profitability, where the manufacturing companies are especially vulnerable. Last Friday, September 10, came a PPI figure for August in the US that showed a 0.6 percent month-on-month increase, after rising by 1.0 percent in July. This week a CPI figure for August in the US is due on Tuesday 14 September, which could be the most important weekly macro figure for the stock market.
The US CPI Index from August 2019 to July 2021
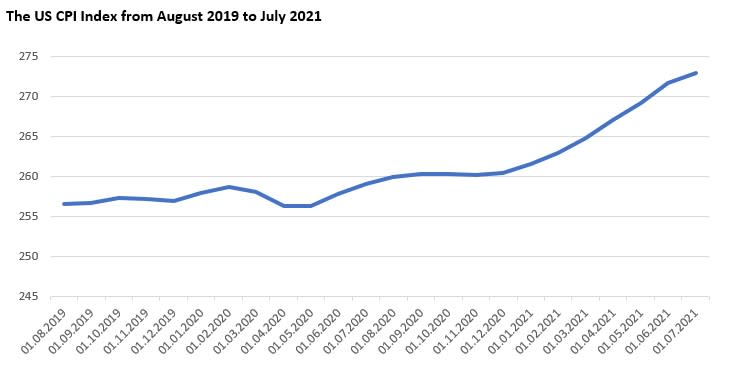
Source: Refinitiv Eikon.
The US 10-year US Treasury yield rose to 1.34 percent on Friday 10 September. The long-term chart shows a clear break in the upward trend since August, although the upward movement since then has not been very strong and especially not in relation to the inflation figures that have been reported. The next Fed meeting where guidance on future central bank-directed interest rates can be obtained is 21-22 September.
The US 10-year government bond yield from December 18th, 2020, to September 10th, 2021

Is it too early to catch the falling knife?
Last week (6-10 September), the S&P 500 index fell by 1.7 per cent. More remarkably, the index finished down every day of the week. On Friday, the index was down 0.8 per cent and closed well below MA20. The next level is the floor of the narrow rising trend channel followed by MA50. As we have mentioned earlier, MA50 has been the level to buy-in previously. Will this be the case once again?
S&P 500 index, February 4th to September 10th, 2021

In the weekly five-year graph below, EMA9 at 4 438 still serves as support.
S&P 500, weekly five-year graph

Note: Past performance is not a reliable indicator of future results.
The technology-heavy Nasdaq had a similar performance as S&P500 during last week. Worth noticing is that MA20 is still intact for Nasdaq. This imply that the potential downside is greater than for the broader S&P 500 index – especially if interest rates will continue to increase.
Nasdaq 100, February 4th to September 10th, 2021

Nasdaq 100, weekly five-year graph

Note: Past performance is not a reliable indicator of future results.
However, news of a court ruling between Apple and Epic on Friday 10 September contributed to some of Nasdaq's decline. Apple shares fell 3.3 percent on the news. From a technical point of view, there is still downside in the Apple share. MA50 just below 148 USD is the first support. If approached, the floor of the rising trend is likely to be tested. Also note the negative divergence between the share and MACD. In case of a break of the trend channel, MA100 may be next. The trying to catch the falling knife in the case of the Apple shares can be seen as a risky trade.
Apple share price graph, February 4th to September 10th, 2021

Apple, weekly five-year share price graph

Note: Past performance is not a reliable indicator of future results.
Google stock also took a hard hit on Friday, down by 1,9%. The share closed at MA20 where the share has been bouncing every time it was tested since June. However, note MACD that is trading at high levels but recently generated a weak sell signal. In case of a break to the downside, the next level can be found around 2 765 USD:
Alphabet (Google) share price graph, February 4th to September 10th, 2021

Alphabet (Google), weekly five-year share price graph

Note: Past performance is not a reliable indicator of future results.
The EUR/USD is consolidating around Fibonacci 23.6. A potential scenario is a continued consolidation until Friday’s CPI-figures in the US.
EUR/USD graph, February 4th to September 10th, 2021

Nevertheless, as from the five-year weekly graph below, it may look like the upside is greater than the downside.
EUR/USD, weekly five-year graph

Note: Past performance is not a reliable indicator of future results.
Bitcoin is currently also consolidating. Note however that momentum is fading, which is clearly visualized by MACD. In case of a break below MA200, MA50 and Fibonacci 38,2 opens for a continued downwards movement towards MA100, currently at 39 764:
Bitcoin graph, February 4th to September 10th, 2021

The weekly volatility is a lovely sight for those into high risk. Note how Bitcoin is still trading above EMA9 in the weekly graph which can be viewed as a sign of continued strength. However, MA20 is falling, which may be seen as a sign of weakness.
Bitcoin, weekly five-year graph

Note: Past performance is not a reliable indicator of future results.
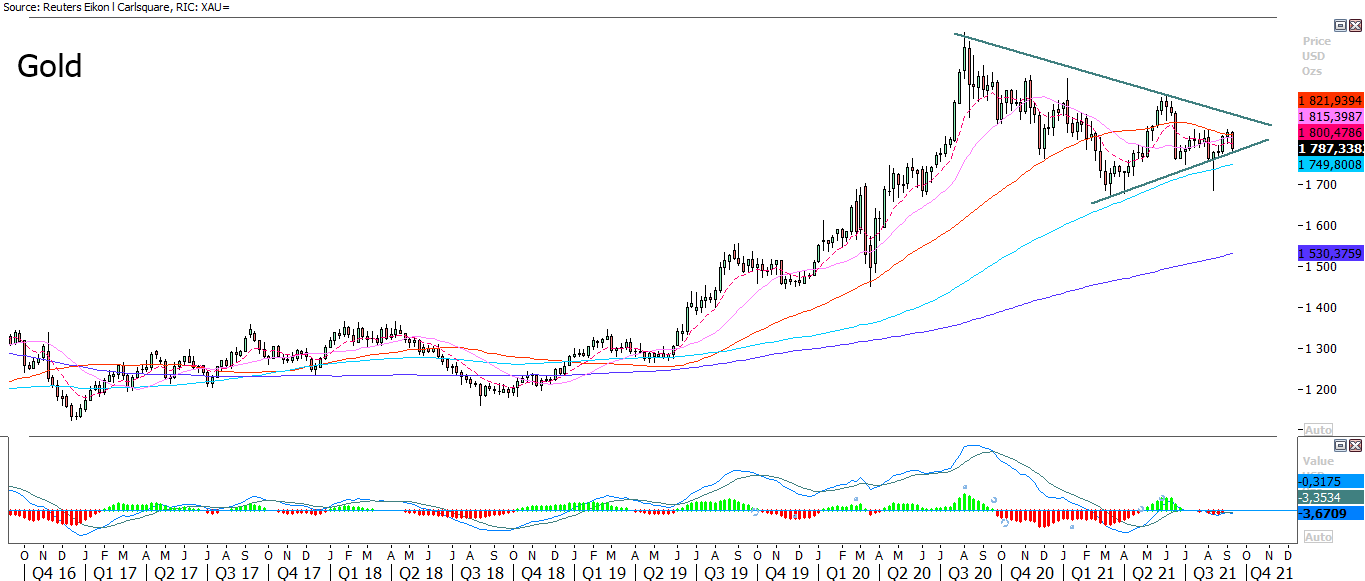
The gold price is consolidating along with the EUR/USD. Gold has historically been a good short-term hedge against increasing inflation
Gold price graph, February 4th to September 10th, 2021

In the weekly graph one can also see how gold is trading in a neutral wedge formation calling for a larger move, up or down:
Gold, weekly five-year price graph
Note: Past performance is not a reliable indicator of future results.
Swedish OMXS30 index has lost momentum. MACD is close to a sell signal. Furthermore, the index is pushed downwards by EMA9 and MA20. However, a cluster of support levels can be found made up by the rising trend channel, Fibonacci 23.6 and MA100:
OMXS30 index graph, February 4th to September 10th, 2021

A falling momentum can also be seen in the weekly graph:
OMXS30 index, weekly five-year graph

Note: Past performance is not a reliable indicator of future results.
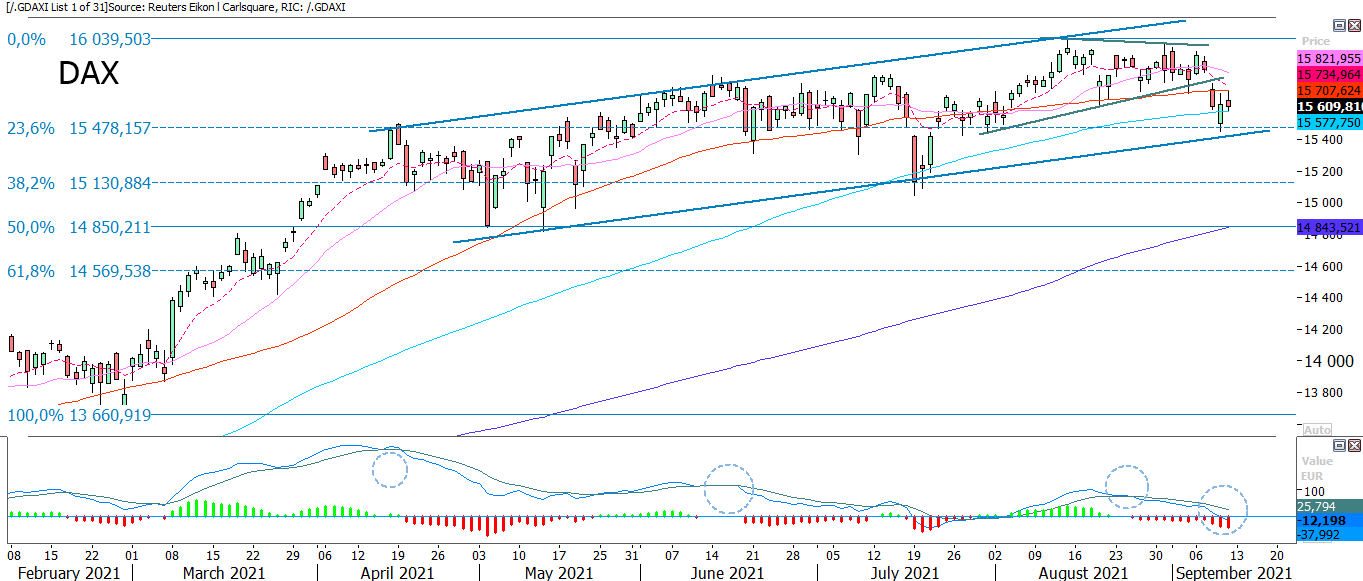
German DAX index managed to close last Friday 10 September above its MA100. But MACD has generated a sell signal. In case of a break of MA100 and the rising trend channel, Fibonacci 38.2 at 15 130 may be next.
DAX index graph, February 4th to September 10th, 2021
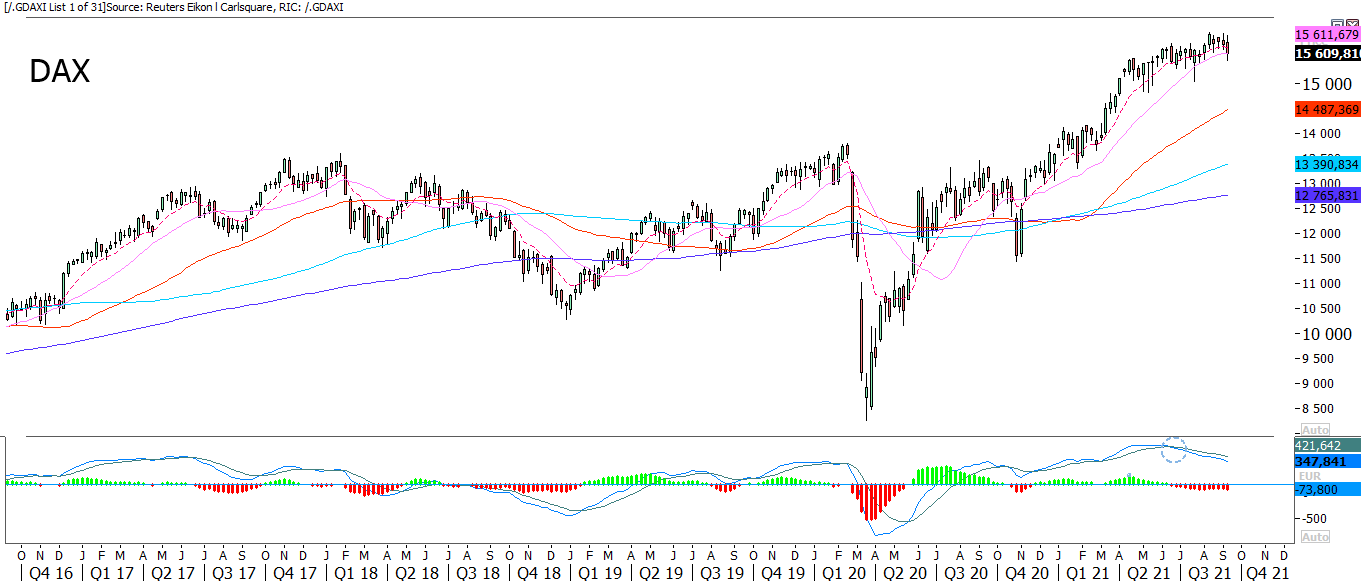
Again, a falling momentum can also be seen in the weekly graph:
DAX index, weekly five-year graph
Note: Past performance is not a reliable indicator of future results.
Full name for abbreviations used in previous text:
EMA 9: 9-day exponential moving average
Fibonacci: There are several Fibonacci lines used in technical analysis. Fibonacci numbers are a sequence of numbers in which each successive number is the sum of the two previous numbers.
MA20: 20-day moving average
MA50: 50-day moving average
MA200: 200-day moving average
MACD: Moving average convergence divergence
Risks
This information is neither an investment advice nor an investment or investment strategy recommendation, but advertisement. The complete information on the trading products (securities) mentioned herein, in particular the structure and risks associated with an investment, are described in the base prospectus, together with any supplements, as well as the final terms. The base prospectus and final terms constitute the solely binding sales documents for the securities and are available under the product links. It is recommended that potential investors read these documents before making any investment decision. The documents and the key information document are published on the website of the issuer, Vontobel Financial Products GmbH, Bockenheimer Landstrasse 24, 60323 Frankfurt am Main, Germany, on prospectus.vontobel.com and are available from the issuer free of charge. The approval of the prospectus should not be understood as an endorsement of the securities. The securities are products that are not simple and may be difficult to understand. This information includes or relates to figures of past performance. Past performance is not a reliable indicator of future performance.