Dax Market analysis, September 2019

DAX declined hard in August and was down -7% at its lowest point. Towards the end of the month, DAX however recovered from the worst decline after sentiment got better and ended the month “only” at -1,5%.
DAX declined hard in August and was down -7% at its lowest point. Towards the end of the month, DAX however recovered from the worst decline after sentiment got better and ended the month “only” at -1,5%.
From a technical perspective, DAX is in a mixed state at the moment and there are both positive and negative signals that should be considered for the near future. The monthly chart is still flagging for a bullish trend, measured with the moving averages EMA6 and EMA12. EMA6 is above EMA12 and DAX is currently above EMA12. On the mid-term trend, there is a different scenario; the trend has turned down measured with EMA6 and EMA12 on the weekly chart. Often when similar events have occurred, the next 2-8 weeks have been more volatile than average.
On the monthly DAX chart below, we can notice that DAX tested the yearly pivot point at 12500. This level held, for now, and is going forward one of the more important levels to watch. A monthly close below 12500 would be bearish.

Long term trend support levels: 11400 - 11500, 10470
Long term trend resistance levels: 12100, 12600
Monthly pivot points plotted on the chart below. The monthly pivot point is located at 11800 and resistance R1 at 12370 and support S1 at 11400. Between S1 and R1, there is almost a 1000p range. It can be expected that R1 or S1 will be tested during the upcoming 3 weeks, volatility/strong moves to be expected. As long as DAX stays above 11800, DAX seems to be more bullish than bearish.

Mid term resistance levels: 12370, 12800
Mid term support levels: 11800, 11400, 10800
The investor sentiment in the USA got really spooked because of the trade disputes among other things and the sentiment is currently way in bearish territory. SPX volatility also spiked but has calmed down a bit, although still above average 6months rolling volatility.


September has often been a very volatile month. The average return for September gives a wrong picture because of the big declines during 2001 and 2002. Q4 has historically been the strongest period and “dip buy” in September has historically been working good.


The percentage of underlying instruments in the DAX index which are above or below its 20 day moving average (DMA20). The last weeks in August, DAX got a bullish push and underlying instruments turned above its DMA20. This seems to be a bullish sign.

The McClellan oscillator is also in the bullish zone.

Technical indicators summary of underlying instruments in the DAX index. The summary is in a mixed mode, where the short term trend seems to be a strong buy, while the technical indicators of the longer term trend appear to move into strong sell.
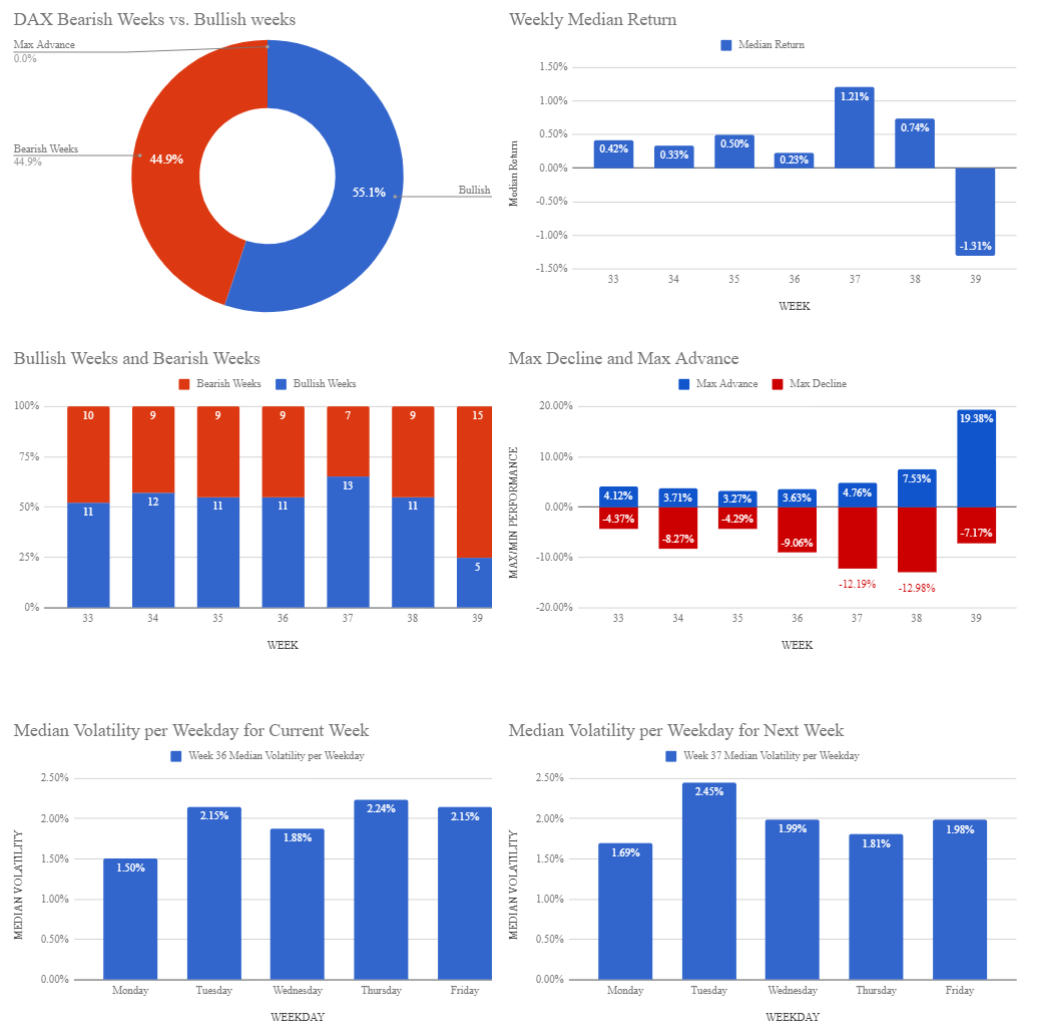
The historical weekly outcomes for DAX in September.
Bull & Bear-Certificates
Note: Please note with respect to the information provided above that past performance of a financial instrument is not necessarily indicative of the future performance of that financial instrument.