DAX Market analysis, October 2019

DAX gained ~4% in September and the month ended close to the yearly resistance level of 12450. A clear trend in the market can not be identified and technically the picture reminds more of range trading than trend trading.
DAX gained ~4% in September and the month ended close to the yearly resistance level of 12450. A clear trend in the market can not be identified and technically the picture reminds more of range trading than trend trading.
The long and mid term trend is still positive, measured with the moving averages EMA6 and EMA12. However, the technical and investor sentiment is not that bullish at the moment, which favours the scenario that range trading will continue. Historically October has been a bullish month for the DAX.
DAX’ longer term trend is still bullish measured with the moving averages EMA6 and EMA12, where the shorter average EMA6 is above EMA12. There is a tough resistance level located at 12500. The closest and most important support level is located at 12260 and it is a good idea to be careful on the long side if we start to trade below this level.

Long term trend support levels: 11400 - 11500, 10470
Long term trend resistance levels: 12500, 12660
The weekly chart below plots the monthly pivot points. The monthly pivot is located at 12260 and resistance 1 (R1) at 12660 and support 1 (S1) at 12040. The moving average EMA6 is still above EMA12 and thus the mid term trend is bullish measured with this tool.

Mid term resistance levels: 12500, 12660
Mid term support levels: 12260, 12040, 11650
The sentiment among US traders is again turning bearish and SPX’ volatility is increasing.

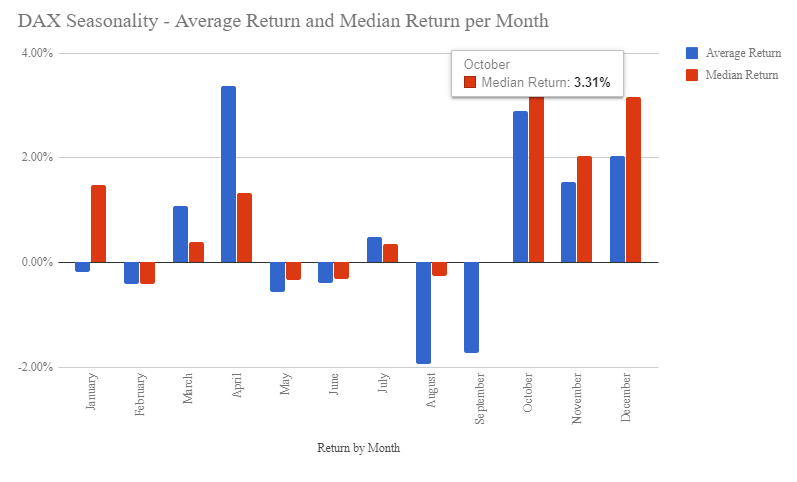
October has historically been a bullish month.

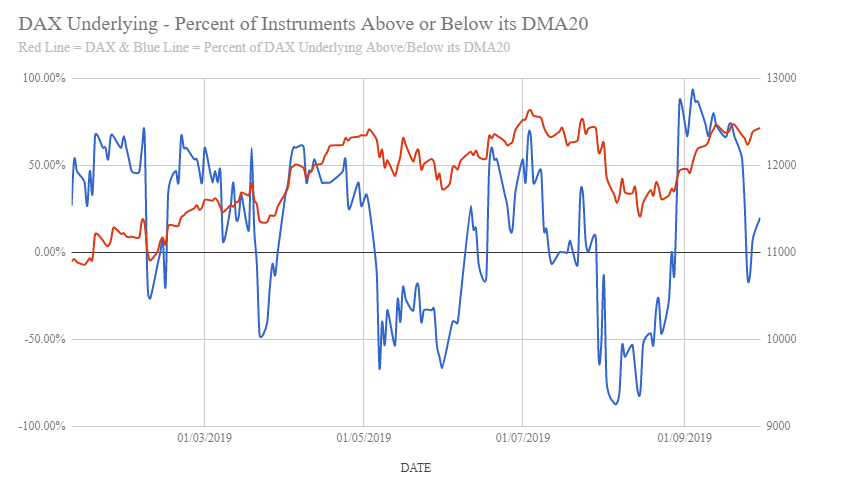
The percentage of underlying instruments in the DAX index which are above or below its 20 day moving average (DMA20). This indicator is neutral at this point.

McClellan oscillator dropped sharply at the end of last month and is currently flagging for heads up.
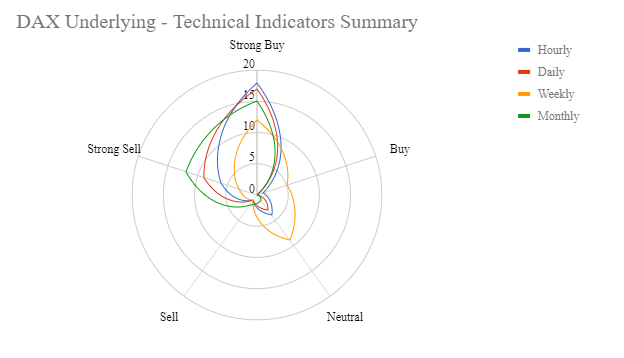
Technical indicators summary of underlying instruments in the DAX index. The mid term trend is turning mixed and thus giving a heads up for the bulls.
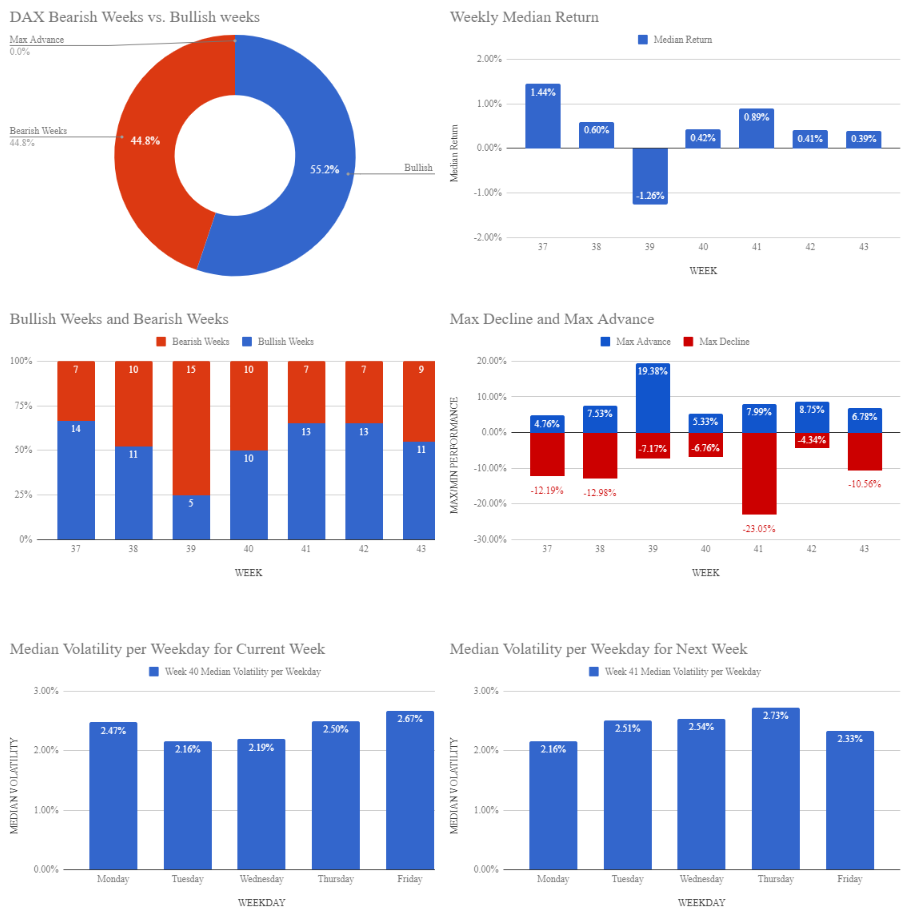
DAX historical weekly price movements for October.
Bull & Bear-Certificates
Note: Please note with respect to the information provided above that past performance of a financial instrument is not necessarily indicative of the future performance of that financial instrument.