Dax Market analysis, May 2019

Investors were bullish in April and DAX advanced ~7%. It is quite seldom, that DAX advances over 5% during a single month. Last time we saw such a bullish advance was in 2015 January, February and March.
Investors were bullish in April and DAX advanced ~7% compared to march. It is quite seldom, that DAX advances over 5% during a single month. Last time we saw such a bullish advance was in 2015 January, February and March.
During the writing of this analysis (6.5.2019), the markets are declining due to the fact that trade wars between China and USA is again making investors nervous. A corrective move of some kind was to be expected, less and less stocks in the DAX index were advancing at the end of April. DAX is currently declining -2,4% and Chinese indices declining more than 5%. VIX, the volatility index, is right now +25%. It is unusual to see such high readings intraday. The correction right now is strong and broad, thus it is very likely that the correction is not over yet and the uncertainty stays in the air for at least a few days.
DAX is technically more bullish than bearish. On the monthly chart, DAX is above its half year moving average (EMA6) which is still navigating north. Also the yearly moving average (EMA12) has turned up. It is also getting closer for a bullish EMA6 and EMA12 cross over, that would indicate a longer term bullish trend indication. It is still to be expected that DAX will touch EMA6 and/or EMA12 during the next 1-2 months. EMA6 is currently 11868 and EMA12 is 11856.
May pivot points plotted on the monthly chart. Careful on long side if the monthly pivot 12100 gives in and we start trade below this level.

Long term trend support levels: 12100, 11800
Long term trend resistance levels: 12650, 12930
The weekly chart is flagging warnings if this week closes at 12150 or below.
On the daily chart, DAX RSI(10) was seen this high in the autumn of 2017. Then a correction followed that was a few % below EMA6 and EMA12 levels. If we have a similar price action this time, we should see DAX testing 11850 area.
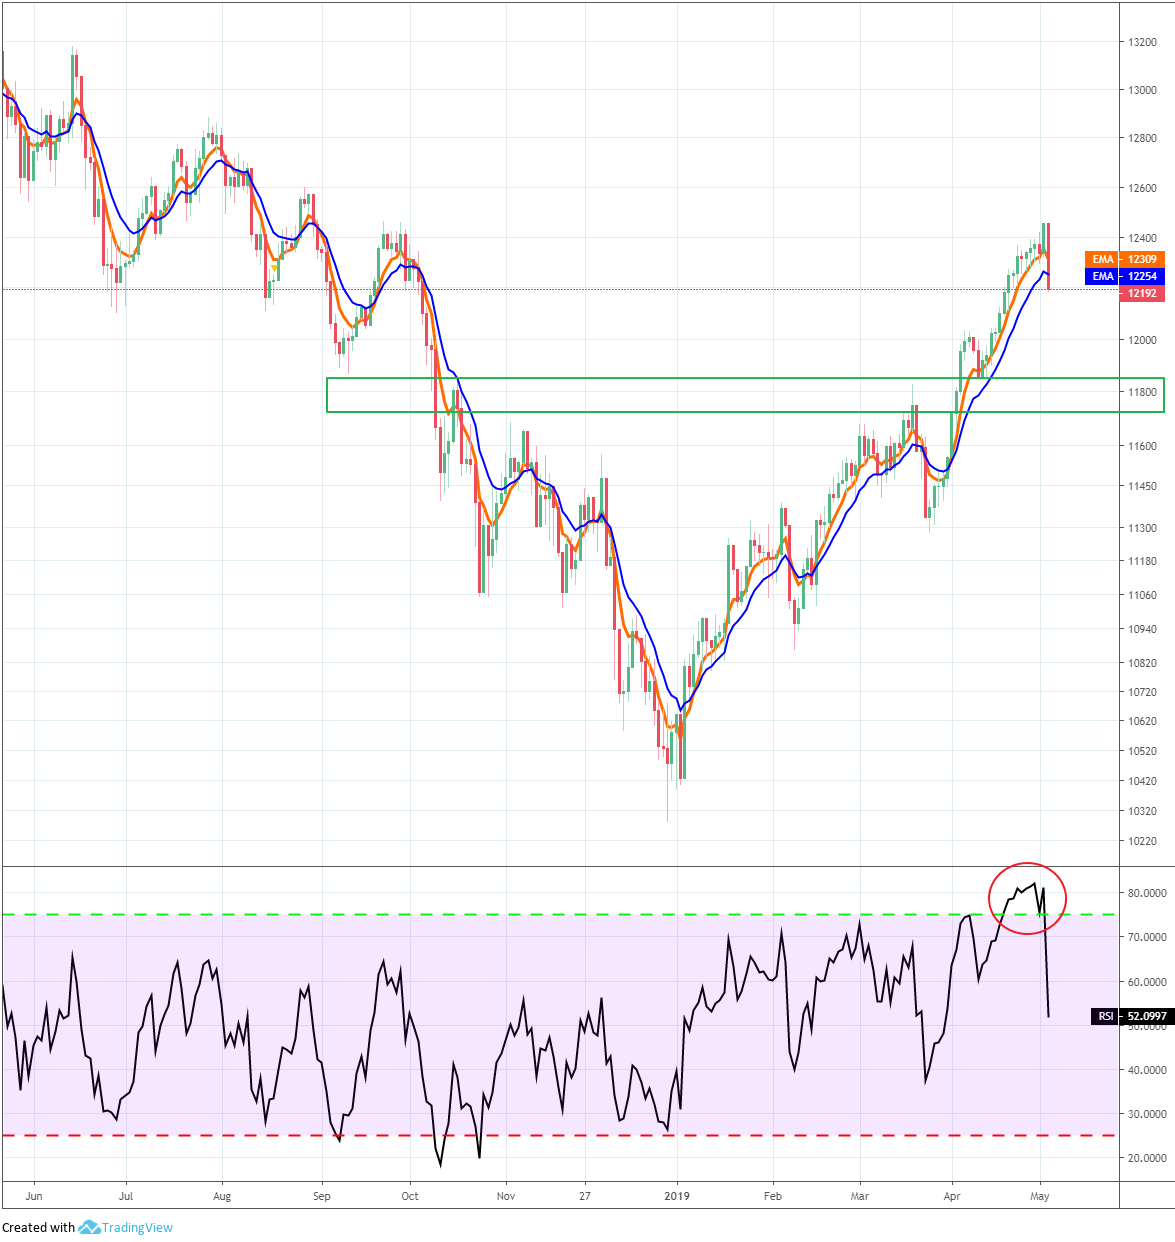
Support levels: 12100, 11800
Resistance levels: 12450
When looking at the investors sentiment in USA, the bullish sentiment has turned up again. And 3.5.2019 there was strong and bullish fundamental data from the USA again. It remains to be seen how the investors react to the latest trade disputes, will the sentiment change for the worse or is it shaken off.

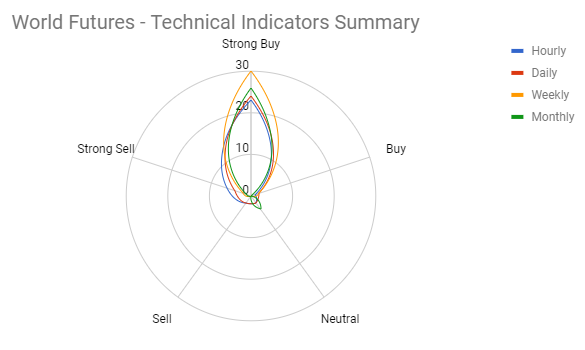
The technical indicators summary for world futures is still in strong buy -mode for all time frames

May has historically been a slightly negative for the DAX.

The percentage of underlying instruments in the DAX index which are above or below its 20 day moving average (DMA20). Note that the amount of stocks above its DMA20 was declining during the end of April which indicates a correction.

The McClellan oscillator is below its zero level and there is also a clear negative divergence . This indicates that the correction is still not over.

Technical indicators summary of underlying instruments in the DAX index. Indicators are still mostly in strong buy territory.

Summary of DAX underlying performance since start of the year. Only a few stocks are a burden for the DAX index when most stocks are advancing.

Historically, the first weeks in May has been the weakest for DAX.