Dax Market analysis, June 2019

Investors were bearish in May and DAX declined ~5%, which resulted in erasing almost all of the gain DAX did during April 2019. June has started in a more positive mood and DAX has already reasonably gained over 3% during writing this analysisthe first few days of the month up to 7.6.2019.
Investors were bearish in May and DAX declined ~5%, which resulted in erasing almost all of the gain DAX did during April 2019. June has started in a more positive mood and DAX has already reasonably gained during the first few days of the month up to 7.6.2019. S&P 500 support at 2800 seems to have ended global market decline - and on top of that FED gave the markets food for speculation about a possible upcoming rate cut, which boosted the markets short term.
The broader picture is technically unstable but as long as DAX is able to stay above 11950, the index seems to be in bullish territory. On the monthly chart, EMA6 is still below EMA12 and thus the longer term trend is down measured with the half year and yearly moving average. DAX is however above both these moving averages and if we get a monthly close above 12050, EMA6 should cross above EMA12 which would be a bullish indication. Historically June has been a bearish month and it remains to be seen if we will get an exception this year and a positive monthly close.
DAX monthly chart with EMA6, EMA12 and RSI. The technical pattern is uncertain going forward, estimate is we trade in a bigger range going forward 1-2 months. If DAX declines below 11950, the index is trading in bearish territory.

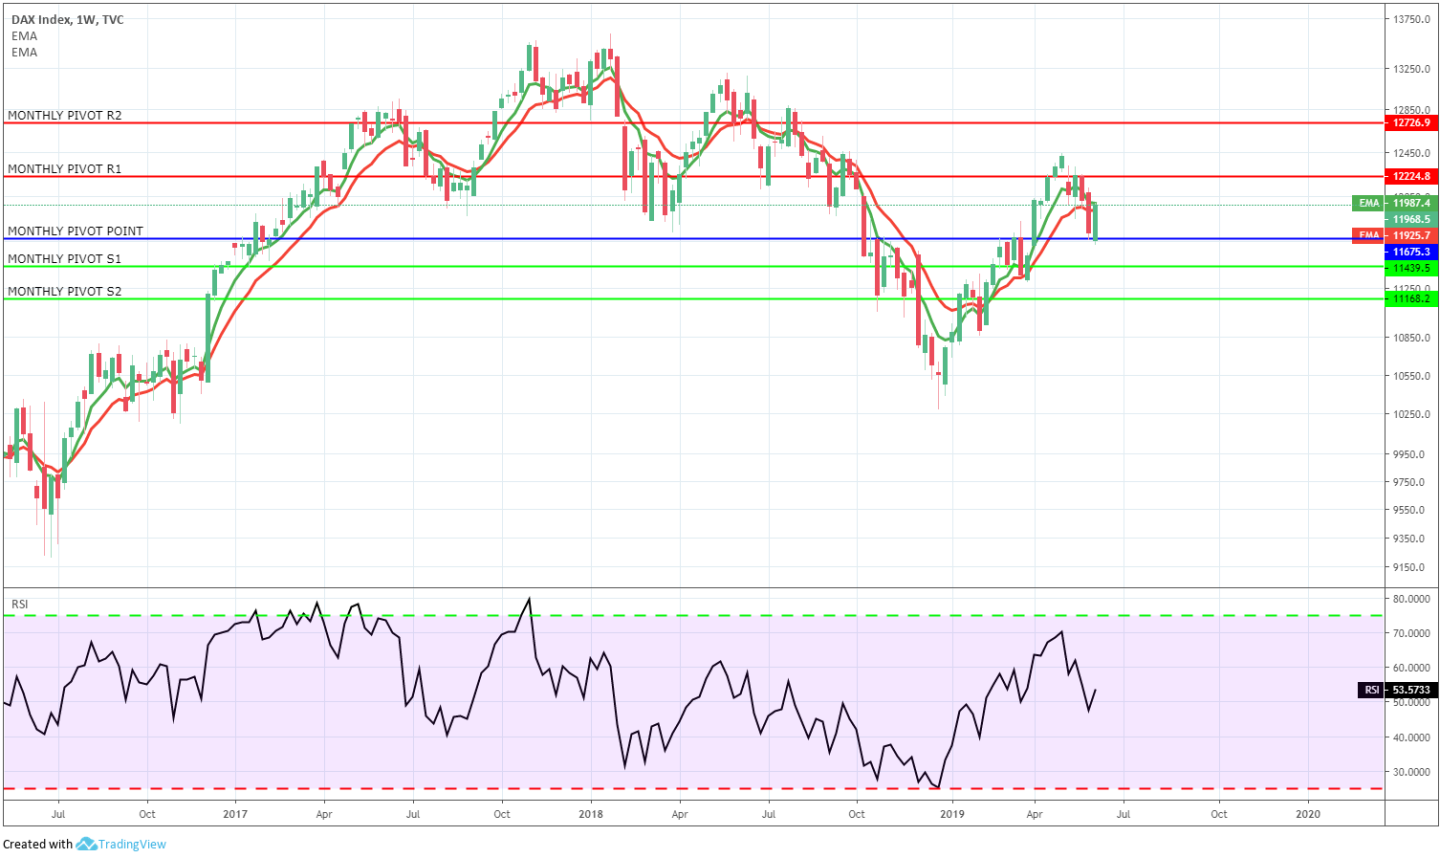
Long term trend support levels: 11950, 11450
Long term trend resistance levels: 12250, 12730
DAX weekly chart with monthly pivot points. The weekly chart will turn bearish if we get a close below 11900.
When looking at the investors sentiment in USA, it has now turned more bearish. Also the S&P500 index volatility has at the same time been increasing and the last weeks volatility has been above average.

Bull & Bear-Certificates

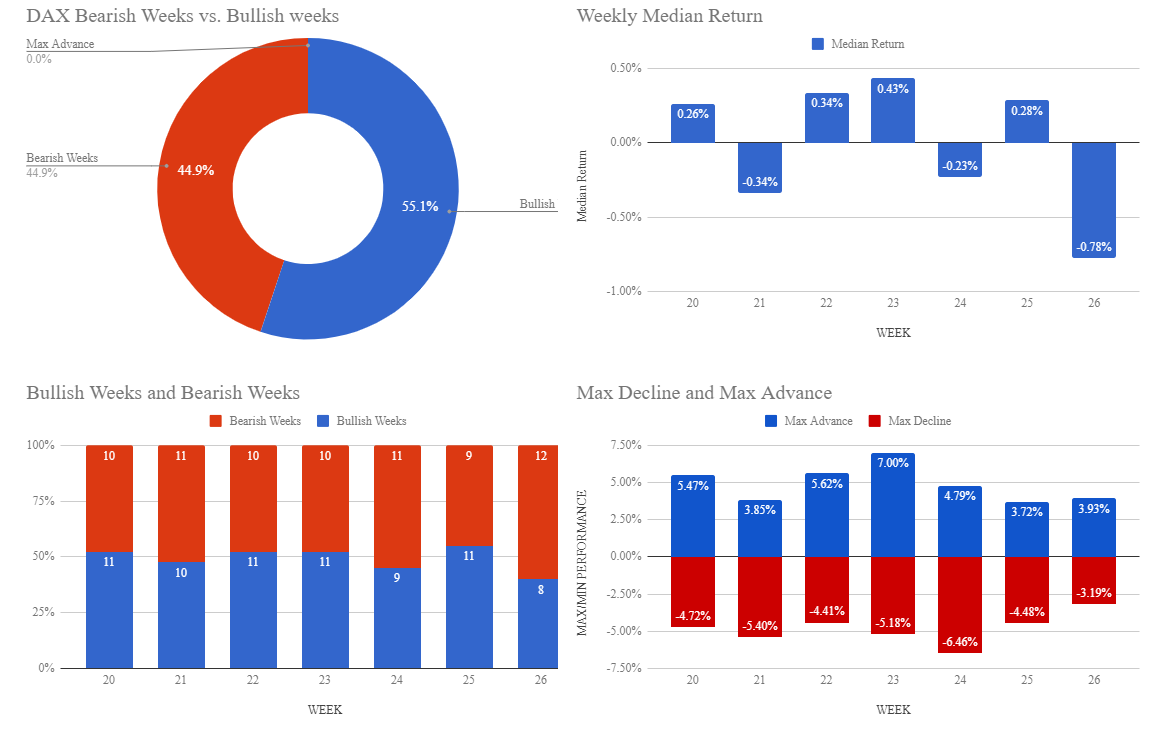
June has historically been a slightly negative month for DAX average return.

The percentage of underlying instruments in the DAX index which are above or below its 20 day moving average (DMA20). If the majority of underlying instruments are below its DMA20 this is a bearish indication.

The McClellan oscillator is about to cross the zero line from below. Also a positive divergence on the oscillator predicted the current bounce in the markets. The indicator is now in neutral territory.

Technical indicators summary of underlying instruments in the DAX index. Short term, indicators seem in strong buy mode when longer term they appear still in strong sell mode.

Technical indicators summary of underlying instruments in the DAX index. Indicators are still mostly in strong buy territory.
Summary of DAX underlying performance since start of the year. Only a few stocks are a burden for the DAX index when most stocks are advancing.
Historically the first week of June has been positive when the second week has been negative. Last week in June has historically been the worst performing week during June.
Note: Please note with respect to the information provided above that past performance of a financial instrument is not necessarily indicative of the future performance of that financial instrument.