DAX Market analysis, January 2020

DAX ended the year 2019 with close to +-0 result in December. We had volatile days in early December and the month did not start bullish. However, the bears did not manage to gain control over the market and bulls took back the early losses towards the end of the month, partially due to re-emerging positivity for trade deal between USA and China.
DAX ended the year 2019 with close to +-0 result in December. We had volatile days in early December and the month did not start bullish. However, the bears did not manage to gain control over the market and bulls took back the early losses towards the end of the month, partially due to re-emerging positivity for trade deal between USA and China.
First days of 2020 have been a mixed plate; markets seemed to want to continue the move upwards but new conflict between Iran and USA turned markets fast into higher volatility mode and the shorter term trends are beginning to show first signs of market weakness.
DAX longer term trend is still bullish, measured with the moving averages EMA6 and EMA12 and the faster EMA6 is also still above EMA12. DAX tested EMA6 level within a few points now in the beginning of January. Intradays are somewhat volatile currently and if the market fears continue for the coming 1-2 weeks, a test of EMA12 (currently at 12550) could take place. The yearly pivot point found at 12350 is not that far away from the EMA12 and if DAX decides to test EMA12, it is likely that the yearly pivot is being tested at the same time.
The longer term trend is still bullish,
measured with moving averages, and if the tension in the middle east eases up
and market gets back on the bullish track, a likely target for testing during
2020 is the pivot resistance 1 (R1) found at 13340. The yearly pivot support 1
is found at 11300. As long as DAX manages to stay above EMA12 on the monthly
chart it is in bullish territory. Vice versa, bulls should be extra cautious if
DAX start to trade below this moving average.
A bearish case could be that DAX forms a
double market top and bears start to take control over the markets. The
resistance level 13450 is an interesting level to watch more closely on the
shorter term trending charts in near future.

Long term trend support levels: 12550, 12350
Long term trend resistance levels: 13450,
14340
Below the weekly chart with monthly pivots plotted. The monthly pivot is at 13200, resistance1 (R1) at 13480 and support 1 (S1) at 12960. DAX has already tested the pivot point and S1 level and currently it seems more likely that we could test S2 during January. The moving average EMA6 is still above EMA12, thus the trend still seems bullish.

Mid term resistance levels: 13400, 13480
Mid term support levels: 12960, 12650
The investor sentiment in USA is on the bullish side but the sentiment got a hit during the last poll and is now declining a bit. The volatility is not yet indicating any bigger red flags.


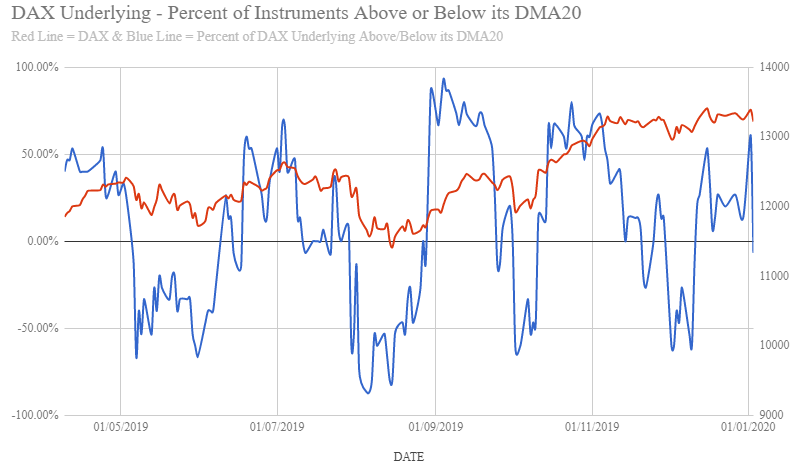
The percentage of underlying instruments in the DAX index which are above or below its 20 day moving average (DMA20). This indicator is in mixed mode, turning a little into bearish territory.
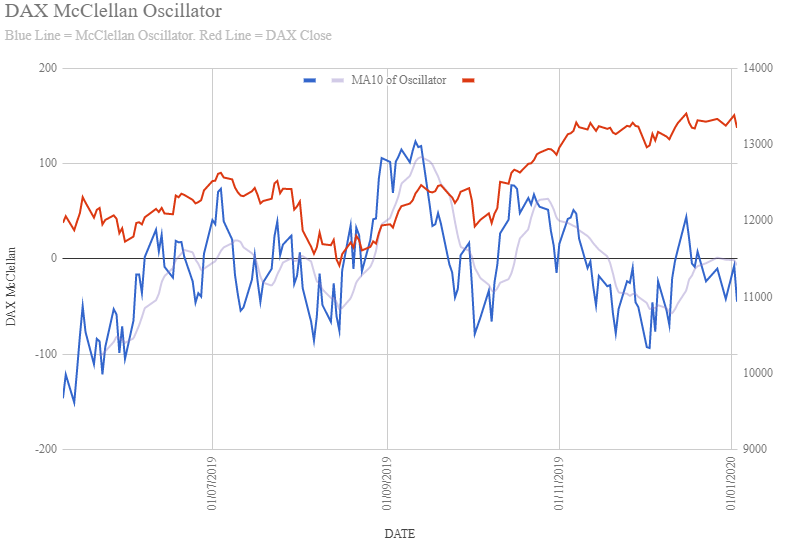
McClellan oscillator is currently slightly bearish.

Technical indicators summary of underlying instruments in the DAX index. Long and mid term trend is still up but are getting more mixed compared to the measurements in December. The short term trend (hourly chart) is flagging sell condition.

DAX historical average weekly moves for January.

DAX volatility has lately been above the average levels.
DAX volatility has lately been above the average levels.
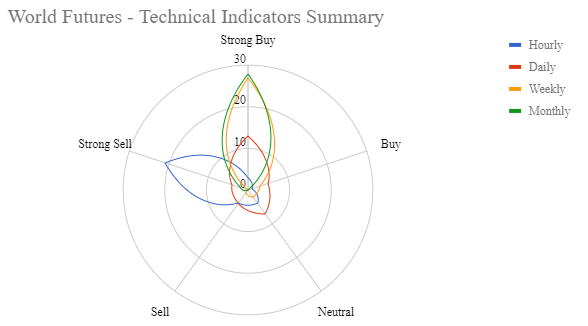
World futures are mostly in buy condition. Only the short term trend (hourly charts) are flagging sell condition while daily resolution is in a neutral or mixed state.
Bull & Bear-Certificates
Note: Please note with respect to the information provided above that past performance of a financial instrument is not necessarily indicative of the future performance of that financial instrument.