DAX Market Analysis, February 2020

January for DAX turned out to be negative -1.4% and on top of a red monthly candle, we have a long wick/shadow, so there was plenty of volatility with strong trend down in the end of January.
January for DAX turned out to be negative -1.4% and on top of a red monthly candle, we have a long wick/shadow, so there was plenty of volatility with strong trend down in the end of January.
January began with a correction downwards, this was reversed and the index continued in a strong uptrend, making a new All Time High (ATH) - even the conflict between the US and Iran could not slow down the market bulls. A new trend down started in late January, one significant contributor being the emergence of the Corona virus and concerns of its impact on global economies - the month was ended in quite a strong bearish trend. Now, as we are writing this in early February, it looks like that also these concerns were short lived.
In the big picture, volatility went clearly up in January and there was no clear direction - first DAX went down, then corrected strongly back up to a new ATH, and then again strongly down.
DAX crossed down both EMA6 and EMA12 trend lines in the early days of January. The 13000 level held and momentum was back to buying the dip, with EMA6 quickly coming back over the EMA12 line – indicating a bullish market. Late in January, DAX came down fast, crossing both EMA6 and EMA12 levels again, also EMA6 crossed below EMA12 for the second time. Monthly Pivot S1 was tested (at c. 12900) and it held, which resulted in a strong move upwards in early days of February, once again returning DAX to a bullish mode.
From technical analysis perspective, long trend is still up but the over situation is less clear; in late January DAX made a new lower low and right after this a new lower high; a classic bearish indicator. It is possible that we see another test to monthly Pivot S1 level (c. 12900).
If the uptrend continues, next possible level to test is monthly R1 pivot at 13600, i.e. almost at ATH numbers. As long as DAX remains above EMA12 on daily chart, the mode remains bullish.
Bearish indicator would be a situation where DAX forms a double top and bears would gain strength for a new leg down.

Long term support levels on monthly chart: 12550, 12350
Long term resistance levels on monthly chart: 13450, 14340
Below is the weekly chart for DAX with monthly pivot levels visible. Monthly pivot level is at 13185, first resistance level (R1) 13440 and first support level (S1) is 12740. DAX has already tested both pivot and R1 levels. EMA6 stays above EMA12 so trend is still bullish.

Medium term resistance levels: 13600, 13880
Medium term support levels: 13000, 12740, 12500

Investors’ sentiment in the USA has changed to slightly net bearish and volatility in S&P500 index has increased.

February has historically been a slightly negative month

Split of shares in DAX index into above and below each respective DMA20 average. Indicator is slightly bullish but does not indicate any clear direction.

McClellan oscillator is also bullish; however, it is good to note that we have seen a turn down in DAX in previous two times in January and December when the oscillator was on this level.
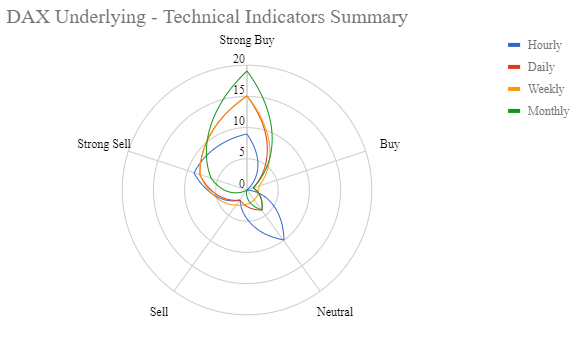
Summary of technical indicators of shares in DAX index: long and medium term indicators continue to indicate ‘buy’, while short term indication (from hourly chart) is neutral

Average historical weekly changes for DAX in February and early March. Historically weakest weeks are already behind us (weeks 5 and 6).

DAX volatility has been slightly above median.
World’s main futures are mostly in ‘buy’ mode; short-term indicators are ‘sell’.
