Dax Market analysis, August 2019

DAX ended in red in July with a decline of about -1,5%. August has started of bearish with DAX already declining -4% as of 5.8.2019 during writing this market analysis. Trade talks between USA and China is back again on the agenda and when looking at technical indicators, this event seemed to have taken investors with a surprise since as an example investors sentiment was bullish and rising 1.8.2019 during the last poll.
DAX ended in red in July with a decline of about -1,5%. August has started of bearish with DAX already declining -4% as of 5.8.2019 during writing this market analysis. Trade talks between USA and China is back again on the agenda and when looking at technical indicators, this event seemed to have taken investors with a surprise since as an example investors sentiment was bullish and rising 1.8.2019 during the last poll. Also market breadth was not in bearish mode and thus this decline could get far worse or aswell continue into a huge rebound phase.
DAX is flirting with a pivotal point drawn in sand at 11600. This level has been tested several times from both below and above and is thus an important line drawn in sand. Below this level and it could turn into panic selling. Above and if this level holds for a few days, it should be read as investor accumulating stocks.
Currently, there is not much value in technical market analysis; indicators and charts mostly signal: stand aside and wait. The current decline is volatile and it is not every month DAX puts in -2% end of day. Trying to pick bottoms in such volatility is not a good idea.
DAX monthly chart below. DAX tested the yearly pivot resistance 1 -level almost at the point and turned down. Currently we have the yearly pivot point at 11500. Current yearly range is bit above 20% which is not extreme nor unusual. A decline towards the yearly support level found at 9370 would fall out of the normal distribution but is more than doable if we go into bearsh mode for the rest of the trading year.

Long term trend support levels: 11500 - 11600,
10470
Long term trend resistance levels: 12100,
12600
Below weekly chart with pivot points for August. We have only traded a few days sofar in August and DAX has already penetrated the support 2 -level and not far away from the yearly pivotal point found at 11500. The level 11600 is an important level for now and 11500 seems like a deal breaker for the rest of the trading year.

Mid term resistance levels: 12300, 12750
Mid term support levels: 11500-11600, 11200
When looking at the investors sentiment in USA, we were in bullish teritority and rising as of the last measurement poll. This should be read as an indication that investors were not prepared for trade talks to enter the market agenda right now.


August has historically been a bearish month for the DAX index


The percentage of underlying instruments in the DAX index which are above or below its 20 day moving average (DMA20). We are currently in bearish teritority. But as already stated above, technical indicators are of little value right now.


Technical indicators summary of underlying instruments in the DAX index. All time frames are flagging more selling.

Historical median return for August has been mixed. The first trading week usually bearish but then bulls has taken over.
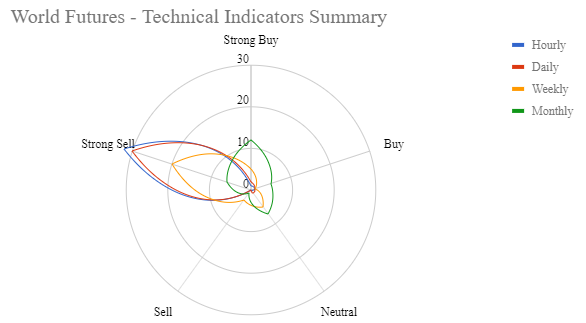
Also the summary of technical indicators are in bearish mode. The long time frame is mixed as of now.
Note: Please note with respect to the information provided above that past performance of a financial instrument is not necessarily indicative of the future performance of that financial instrument.