DAX Market Analysis, April 2022


April became an unusually interesting month as volatility was high - difference between beginning and end of March was only ca +80 points but range for the month was ca 2500 points - so plenty of opportunities for traders. From a technical perspective, monthly candle for March is slightly bullish but there is no technical clarity that DAX would turn back upwards from here.
April became an unusually interesting month as volatility was high - difference between beginning and end of March was only ca +80 points but range for the month was ca 2500 points - so plenty of opportunities for traders. From a technical perspective, monthly candle for March is slightly bullish but there is no technical clarity that DAX would turn back upwards from here.
Exponential moving averages EMA6 and EMA12 functioned as resistance levels in March on the high side and on the low side DAX almost tested yearly S2 pivot. Historical pattern for stock exchanges during break out of a new war or conflict has been fairly strong recovery after first major drop downwards - and this is also within possibilities now as we go forward.
One important item to follow is whether DAX is able to cross and stay above EMA6 and EMA12 lines which could confirm that uptrend resumes. Until then, picture is quite unclear and high volatility means that big moves up and down are possible. So likelihood for good opportunities for long and short trades is high.

Long term support levels: 13000, 14000
Long term resistance levels: 14820, 15150, 16000
Weekly chart below - DAX started March with a strong drop, monthly S1 pivot was momentarily crossed downwards. With 12500 holding, strong uptrend resumed. Also on weekly chart, EMA6 and EMA12 lines worked as resistances (as previously they were strong supports) so also here it is key to follow if DAX can cross above these lines or they continue to work as resistance from where DAX bounces back downwards. If DAX can cross the levels upwards and stay there, it would be additional validation for possible trend up. Index remains in downtrend and new test for EMA6 and EMA12 levels is possible. (EMA6 is right now 14600 and EMA12 14350 on first week of April).

Mid term support levels: 12940, 13940
Mid term resistance levels: 14350, 14620, 15000
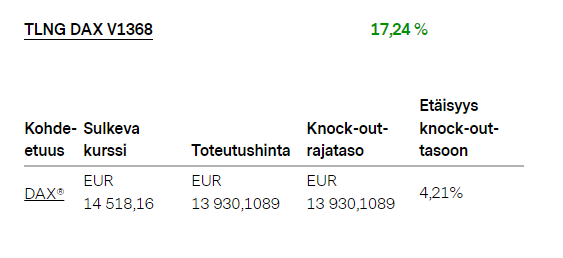
For a Long swing position, it is important to follow whether DAX can break EMA6 and EMA12 levels up on weekly chart. If this happens, these levels should then work as support levels for uptrend to start. EMA12 (right now 14350) could work as potential good entry level with fairly tight stop. For example TLNG DAX V1368 is an option for this:
For Short trade, DAX most likely should stay below EMA6 and EMA12 levels, them working as resistance. E.g. EMA6 line could be a potentially good entry for a short, using e.g. TSRT DAX V1246


Above: DAX average monthly movement - April has been a strong month.

Above: McClellan oscillator is very bearish, to a point that pullback upwards is possible.

Above: Split of shares in DAX between those above and below their respective daily moving averages DMA20. The indicator is showing very bearish readings so also here a signal for potential bounce upwards.

Above: Summary of technical indicators for DAX. The technical picture is simply a ‘sell’ situation.
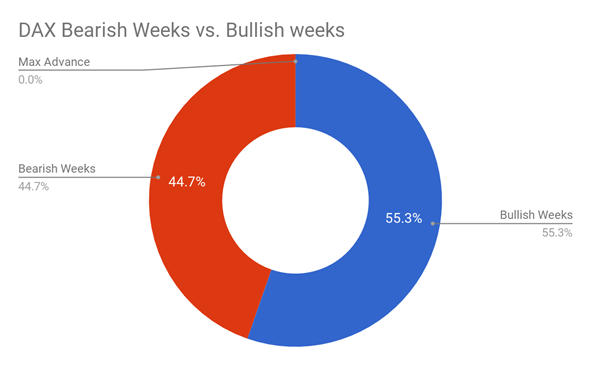


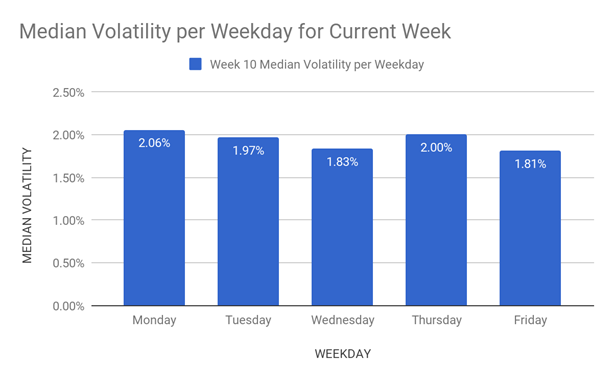

Above: Historical weekly and daily movements for DAX.
Risks
This information is neither an investment advice nor an investment or investment strategy recommendation, but advertisement. The complete information on the securities, in particular the structure and risks associated with an investment, are described in the base prospectus, together with any supplements, as well as the final terms. It is recommended that potential investors read these documents before making any investment decision. The documents and the key information document are published on the website of the issuer, Vontobel Financial Products GmbH, Bockenheimer Landstrasse 24, 60323 Frankfurt am Main, Germany, on prospectus.vontobel.com and are available from the issuer free of charge. The approval of the prospectus should not be understood as an endorsement of the securities. The securities are products that are not simple and may be difficult to understand. Past performance is not a reliable indicator of future performance.